Abstract
The rock avalanche at Turtle Mountain, Canada, in 1903 destroyed the town of Frank causing the death of approximately 70 people. The geological unstable mountain still poses danger for the surrounding villages. In order to prevent future causalities, the Government of Alberta initiated a detailed geotechnical hazard assessment of Turtle Mountain. In this paper, we report on ground penetrating radar (GPR) measurements, which have been conducted on the mountain’s summit to determine the depth and dip of potential fractures and fissures. The migrated data sets clearly show many coherent features to a maximum depth below surface of 40 m that reflect the layer bedding at Turtle Mountain as well as steep fractures cutting through the rock. These measurements demonstrate that ground penetrating radar is a useful survey technique to image the near-surface structure for fracture determination.
Introduction
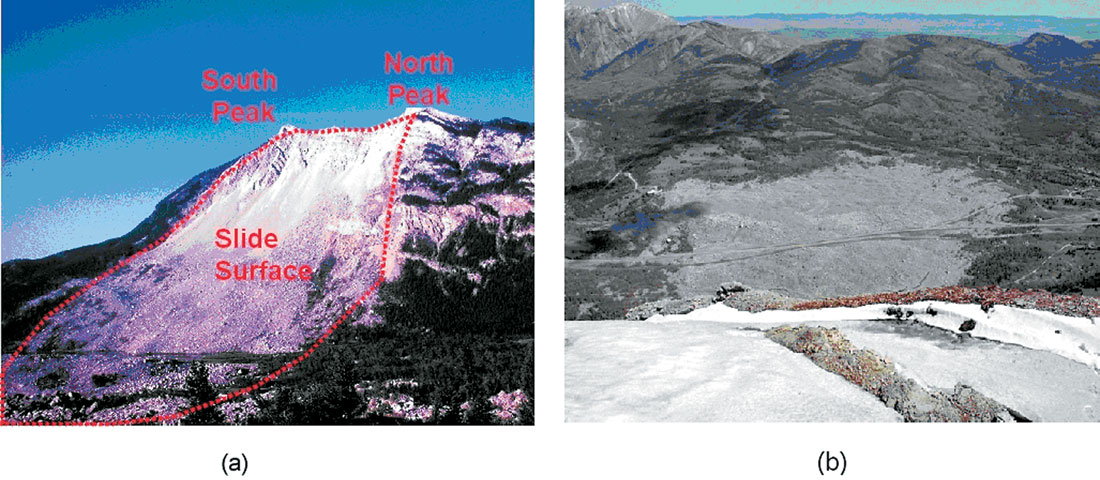
In a disastrous rock avalanche in the early morning of April 29, 1903, approximately 30 x 106 m3 of the east limb of the Turtle Mountain anticline slid down and destroyed the southern end of the town of Frank. This event, known as the Frank slide, lasted for about 100 seconds and covered an area of approximately 3 km2 with an average height of 14 m of rubble. After the rockslide, the summit of Turtle Mountain still reaches approximately 900 m above the surrounding valley. The photographs in Figures 1a and 1b show the present state of Turtle Mountain. Figure 1a shows the rock slide area and the remaining peaks, today called South Peak and North Peak, as seen from the valley; the photograph in the second picture shows the deposit area of the slide seen from the top of the mountain (view from South Peak towards east).
The winter of 1902 - 1903 left a heavy snow pack on Turtle Mountain’s summit. April 1903 had been unseasonably warm, with much of the snow melting and feeding the mountain’s fracture network. It is presently assumed that the water froze in a sudden temperature drop during the night of April 28. This caused the cracks to expand and eventually triggering the collapse of Turtle Mountain (Benko and Stead, 1998). We learn from Cruden and Krahn (1973), that “the slide mass lay on the steeply eastward dipping limb of the anticline and the crest of the fold lay very close to the crown of the slide. The slide probably took place on bedding surfaces with the orientation of the sharp and lateral margins of the slide controlled by joint sets.”
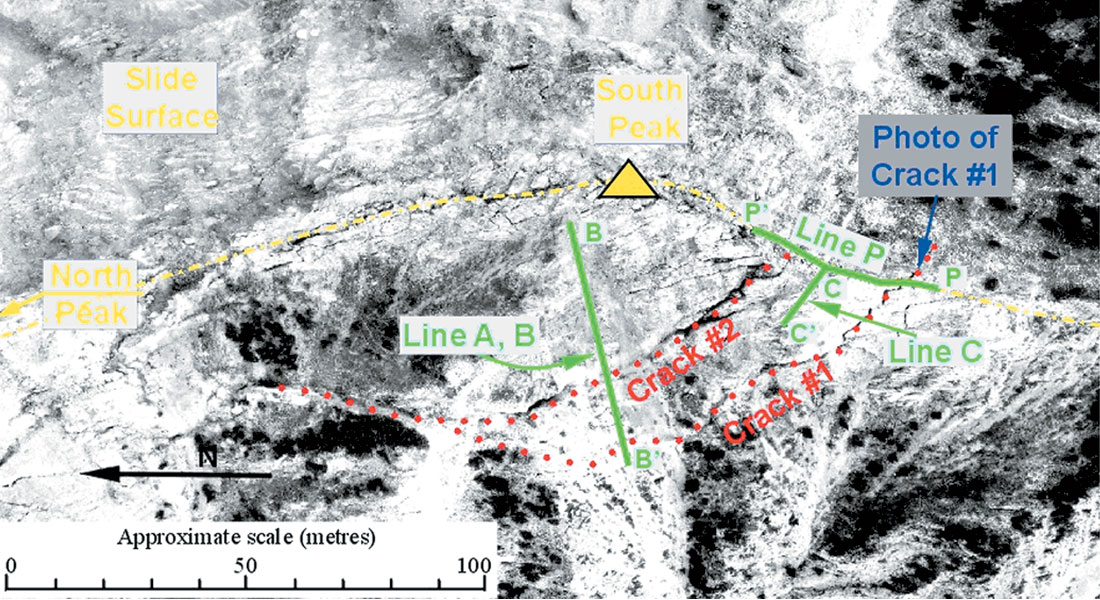
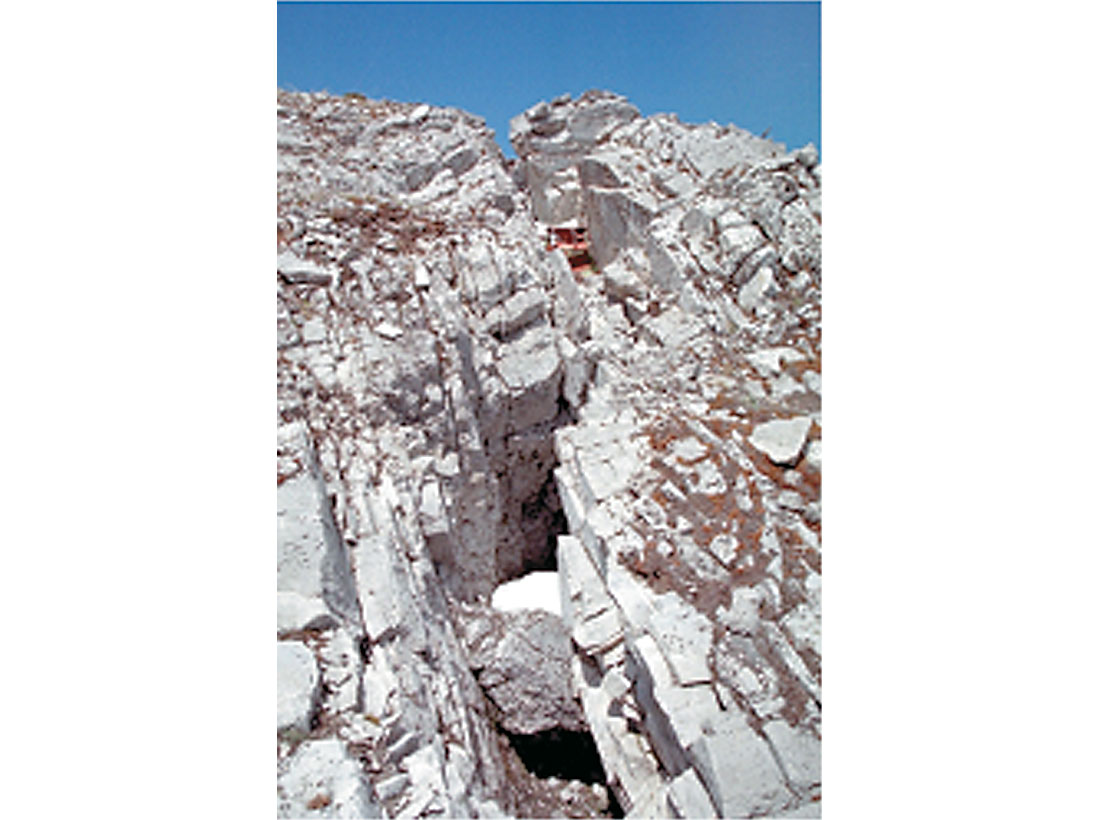
Turtle Mountain may still pose danger to the surrounding settlements. A network of deep sub-vertical fissures still presents a potential cause for future rock slides. The aerial photograph of Turtle Mountain’s summit (Figure 2) shows several fractures, with the two largest ones being labelled as Crack #1 and Crack #2, respectively. However, there are more fractures visible in the photograph, most of which are parallel to Cracks #1 and #2.
When analysing the stability of the South Peak between 1931 and 1933, Allan (1933) estimated that approximately 5 x 10⁶ m3 form a “danger zone” for a potential future hazard. After the government of Alberta initiated an extensive monitoring and geotechnical hazard assessment program (e.g., Read et al., 2000), Turtle Mountain has attracted considerable attention. It is currently the focus of a monitoring research project that combines efforts from geology, geophysics, and geomechanics. In the past, monitoring was mainly based on strain gauges installed in deep cracks and repeated aerial photographs. In the current phase, the monitoring program is extended by microseismic observation systems (e.g., Stewart et al., 2004), continuous GPS measurements, and laser interferometry to detect small movements of the mountain. Additionally, an extensive surface mapping program of fractures at the mountain’s summit was conducted during 2004. To investigate the presence of deeper fractures, an approximately 60 m deep borehole has been drilled in 2004 (Spratt and Lamb, 2005).
Geologic maps based on surface mapping and the analysis of aerial photographs tend to emphasise the steeply dipping features, whereas borehole geophysics allows for the point wise detection of potentially dangerous weakness zones that are naturally not obvious during surface mapping. As borehole information and surface mapping provide data only for a small portion of the mountain, surface geophysical measurements can provide complementary information over a larger area.
Knowledge of the fracture shapes and trends at depth relative to the mountain slope is important in order to further estimate the amount of rock mass likely to collapse. To assist in the hazard assessment project, we carried out several geophysical measurements using a ground penetrating radar system on Turtle Mountain. GPR is a frequently employed geophysical technique in near surface studies. While it is often used in environmental studies, it has also been utilised in fracture detection (e.g., Grasmueck, 1996 and Willenberg et al., 2004). The intent of our surveys was to map out the near surface structure of Turtle Mountain’s summit at several locations, where large fractures are cutting deep into to the mountain. We carried out four surveys on top of Turtle Mountain using three different antenna frequency systems between 50 and 200 MHz, respectively. However, it seems that the highly fractured summit does not allow a high frequency signal to penetrate substantially deep into the underground, as we were not able to record significant reflections with the 200 MHz antennas. The locations of the four GPR surveys carried out at Turtle Mountain are displayed in the aerial photograph (Figure 2). In this paper, we describe only measurements conducted with 50 MHz antenna system along an approximately 100 m long profile at the West Slope of Turtle Mountain (Line B), further results can be found in Theune et al. (2005a).
Data processing
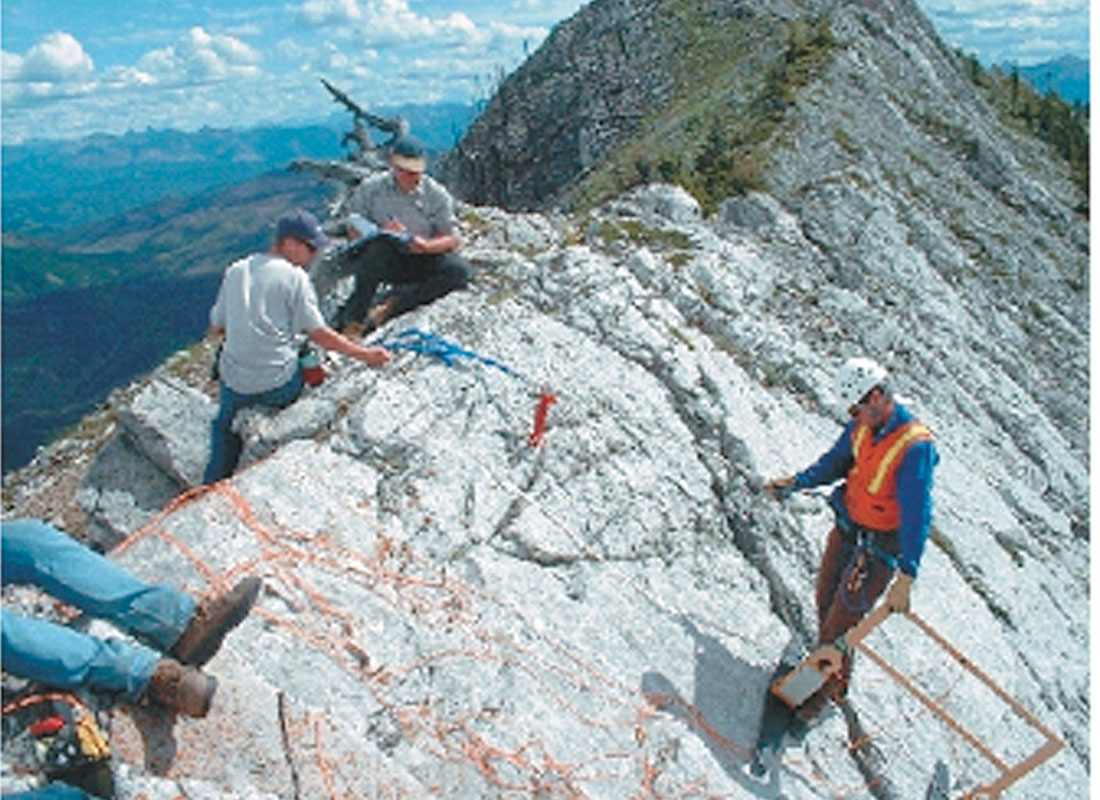
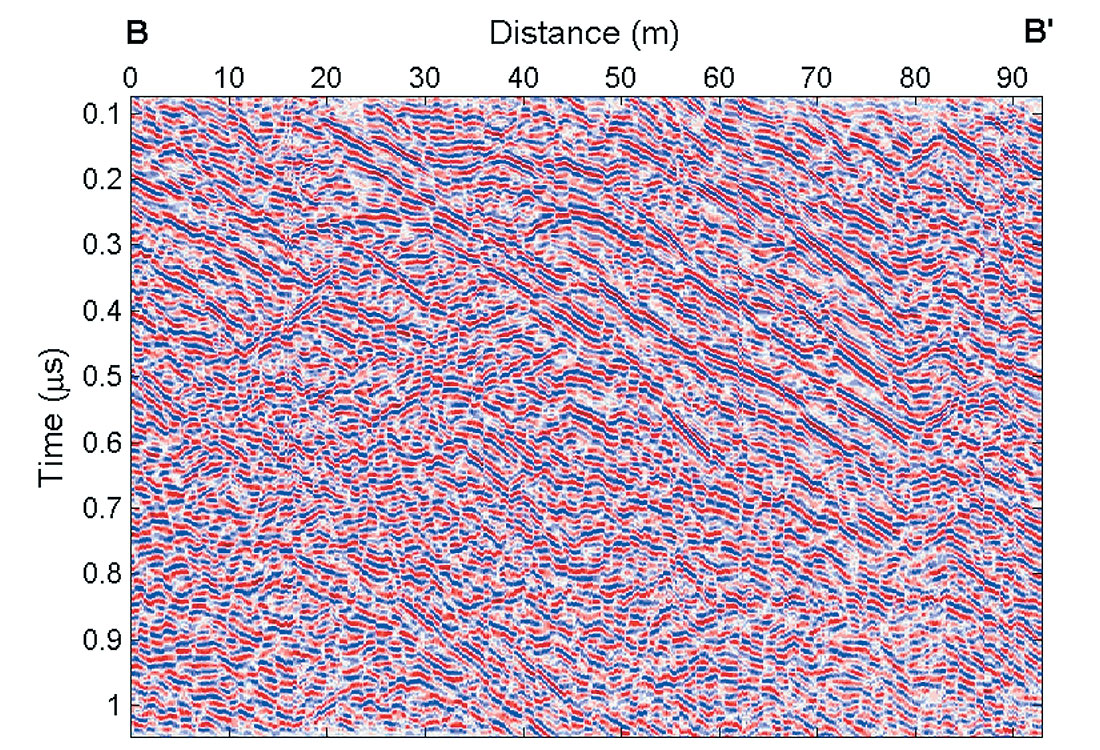
The data were acquired using a 50 MHz Mala Ramac II GPR system on a former rock avalanche area with the surface layer mainly covered with loose limestone scree. Generally speaking, Turtle Mountain’s summit was not an optimum place for GPR data acquisition. The terrain was rough and steep with – for GPR data – quite significant surface topographic variations. The photograph in Figure 4 shows line C, located at a steep slope just off the mountain’s crest. At this location, the antenna operator needed to be secured by ropes. The main survey was carried out along lines A and B on the West Slope; a former rock avalanche zone that dips 29° with respect to the horizontal plane. These lines intersect the major fractures at approximately 56 m and 80 m survey length, respectively.
We applied a simple processing scheme to the data. First, the traces were shifted in time to correct for topographic effects when necessary, followed by amplitude gain (AGC) to correct spherical dispersion and frequency filtering The processed raw data are shown in Figure 5. After processing, linear events dipping downwards with progressing profile length are readily observable. These strong and coherent reflectors are most likely related to bedding planes. However, the presence of numerous small reflectors with different dips complicated the interpretation of the data considerably.
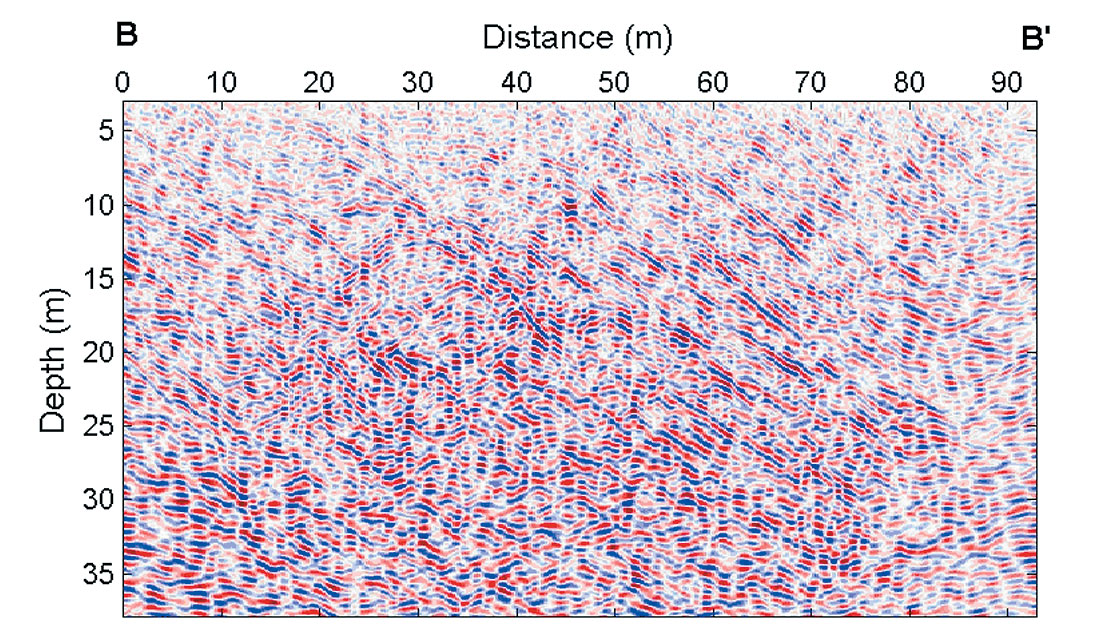
Afterwards, we applied a Kirchhoff migration algorithm. As we do not know the actual GPR velocity of the fractured rock, we were facing an additional difficulty when choosing a proper velocity for the migration. We therefore used a wide range of migration velocities distributed around the typical velocity for limestone of v=0.12 m/ns (e.g., Davis and Annan, 1989). From the migrated data we chose those for further analysis that do look most reasonable.
Following Fisher et al. (1992), we chose those migration results as reasonable in which the image appeared to be well focused and diffraction hyperbolas collapsed completely. However, the GPR data from Turtle Mountain are of such a poor quality that a decision on a single migration velocity was not possible. Instead, we analysed several migrations and combined these for a joint interpretation. This approach mimics that employed when iterative migration trials are used to refine velocity structure in reflection seismology. In our migration trials, we used velocities in the range between 0.06 m/ns and 0.16 m/ns and found that the results using velocities between 0.07 m/ns and 0.10 m/ns gave the best results. An example of the migration results is shown in Figure 5, where a migration velocity of vmig = 0.08 m/ns has been used.
The migrated data displayed in Figure 6 show several linear coherent events, which form two patterns with different dips. A dominant system of reflectors appears to dip approximately 54° to 59°. However, this is also approximately the dip of the layer bedding at this part of Turtle Mountain (C.W. Langenberg, Alberta Geological Survey, personal communication). Therefore , these events are probably not primarily related to fractures. On the other hand, these reflections are discontinuous and often intersected by reflectors that dip approximately 179°, indicating that the bedding planes are possibly fractured.
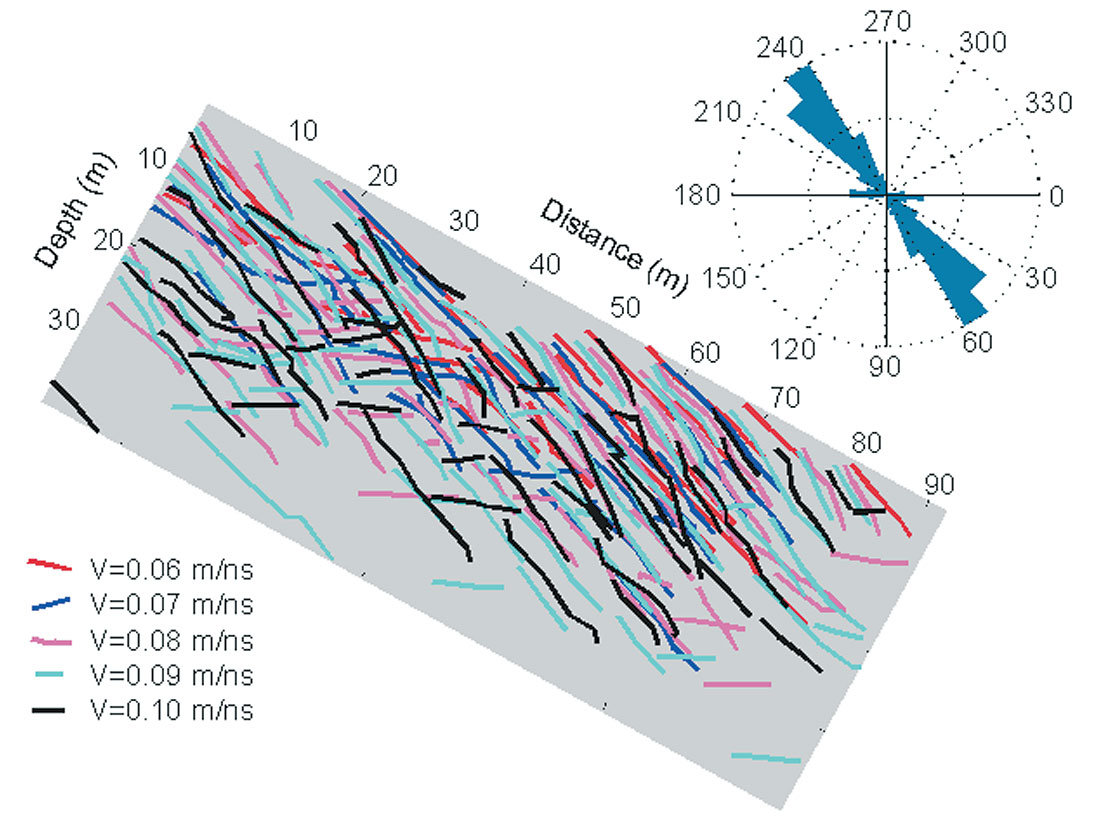
As a last step in the analysis procedure, we determined the maximum depth and dip of these events from the GPR images. Unfortunately, the values of these two important parameters in constructing geomechanical models depend on the migration velocity. This non-uniqueness adds a significant uncertainty to the interpretation results. To address this uncertainty, we first determined these parameters for coherent linear events in each image migrated with different velocities separately. In a second step, we combined all the inferred dips and analysed them statistically. It is generally difficult to follow a reflector in the migrated data, as the rock mass seems to be highly fractured. Many reflectors are discontinuous and often intersected by other reflections. Often, the position of a point on a reflection must be assumed. Therefore, a significant uncertainty in the inferred events from the migrated data must be taken into account. The interpretation results are summarised in Figure 7, in which the axis system has been rotated by 29° to accommodate for the mountain’s slope, as measured by differential GPS surveying. The dominant pattern with dips of approximately 58° measured from the horizontal becomes readily apparent. In particular, numerous events with nearly horizontal dips may be seen at depths from 10 to 30 m at profile length positions between 20 and 40 m. The rosette in Figure 7 displays the relative number of dips for all reflectors. The length of each segment represents the relative number of dipping reflectors per 10° interval. This diagram also shows that probably the layer bedding dominates the reflections in the GPR survey at the West slope but that there is also a quite significant pattern with nearly horizontal dip.
Results and Discussion
The experimental results of the GPR data acquired at Turtle Mountain are promising for mapping fractures at the mountain’s summit. A significant depth penetration normal to the surface was achieved, especially with lower frequency antennas, allowing mapping out the fracture system to a depth of more than 35 meters. Many fractures were readily apparent in the raw data, and more features became clearly visible after basic processing, mainly consisting of amplitude recovery and frequency filtering (Figure 5). However, due to the highly fractured nature of the rock material these images contain many details besides the main reflectors.
After migrating the data acquired at the West Slope, a pattern of two consistent events was detected which we interpret as a network of two fracture systems. In the migrated sections, it seems that the events are not continuous but often terminate at another fracture. Sometimes, a reflector continues deeper but with an offset to its original locus. A system with an average fracture dip of 54±8° dominates in number of fractures and fracture length. Even if these reflections are caused by bedding planes, such information are important, since sliding along bedding planes occurs at Turtle Mountain’s West Slope (C. W. Langenberg, personal communication). At this point, the statement by Cruden and Krahn (1973) suggesting that the 1903 rockslide occurred along a bedding surface appears to be true. Hence, such information on the geometry of the bedding planes is valuable input for stability analysis of the West Slope. The second, less numerous, fracture system is nearly horizontal and is oriented approximately 120° to the main fractures.
The high resolution potential of ground penetrating radar and the highly fractured rocks at Turtle Mountain’s summit resulted in fairly poor data quality. As such, the processing, analysis, and interpretation of the data were challenging and often non-unique. These difficulties are carried forward to the final results of the interpretation, namely the dip and depth of bedding planes and fractures. An improvement of the interpretation could certainly be obtained when we could manage to extract the strong coherent events from the more randomly occurring small scale scatters in the data. A very successful approach has been presented by Theune et al. (2005b, c) that is based on dip dependent image decomposition using local Radon transforms.

Acknowledgements
Numerous people assisted in the acquisition and interpretation of the ground penetrating radar data at Turtle Mountain. We like to thank David Cruden, Mike deGroot, Julia Holzhauer, Dan Kenway, Dean Rokosh, Marek Welz, and Willem Langenberg. The data acquisition and analysis was funded by NSERC, the Canada Research Chair program, both granted to D. R. Schmitt.


Join the Conversation
Interested in starting, or contributing to a conversation about an article or issue of the RECORDER? Join our CSEG LinkedIn Group.
Share This Article