Introduction
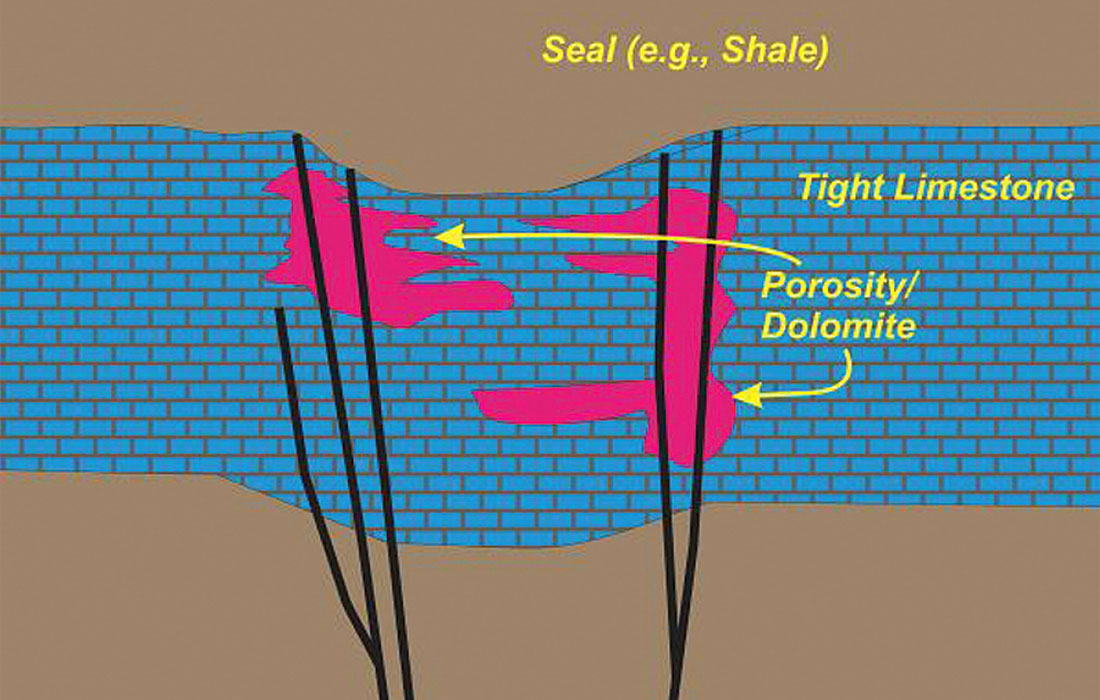
Hydrothermal dolomite reservoirs present special exploration and development problems that are important to seismic interpreters. The productive, porous dolomites can be present at various stratigraphic levels and are typically associated with complex faulting and fracture networks (Figure 1). These structures acted as conduits for the dolomitizing, and porosity generating, fluids. The fractures currently help to provide the permeability that allows these rocks to produce oil or gas at economic rates, although permeability (and most of the porosity) is also present in the porous dolomites. It is therefore critical to define the 3-D distribution of porosity and fracture networks in order to properly develop a hydrothermal dolomite field.
The Ladyfern discovery of northeastern British Columbia is an example of one such reservoir where better geologic characterization could have been useful. Some wells in that field flowed at an initial rate of more than 100 mmcf/d, and recoverable reserves were initially reported as up to 1 tcf. However, that reserve figure was later downgraded to 400 bcf based on drilling results and unexpectedly early water production. Clearly, the 3-D distribution of reservoir-quality rock and the extent of the permeable fault and fracture networks were improperly understood, at least by some operators.
Experience has shown that 2-D seismic data are inadequate for defining the 3-D distribution of either faults or porosity in hydrothermal dolomite systems. The lateral variability in faulting and porosity is too great because, for instance, the faults typically comprise some component of strike-slip movement that leads to en echelon fault geometries. Despite these limitations, 2-D seismic data were used extensively in the 1990s and early 2000s to explore for hydrothermal dolomites in the Ordovician Trenton and Black River intervals of the Appalachian Basin. Interpreters, typically working at or for small independents, examined the seismic data for a combination of qualitative attributes that included small graben structures (porosity is typically found in the grabens and not on the flanking highs), lowered amplitudes in the grabens, reduced frequency in the grabens, and other indicators of porosity development. Success was mixed at best.
Despite these frustrations, the Trenton-Black River has a long history of oil and gas production that includes the giant Albion-Scipio Field (less than .8 km wide but nearly 50 km long, with cumulative production of over 250 mmboe) and more recent discoveries in the Finger Lakes area of New York. For example the Reed #1 well, drilled by Talisman’s American operating company Fortuna Energy Inc., had an IP of more than 40 mmcf/d, making it the best well drilled in the onshore US in 2004. Von Rudloff (2006) summarized Talisman’s experiences in exploring for and developing Trenton & Black River reservoirs in New York.
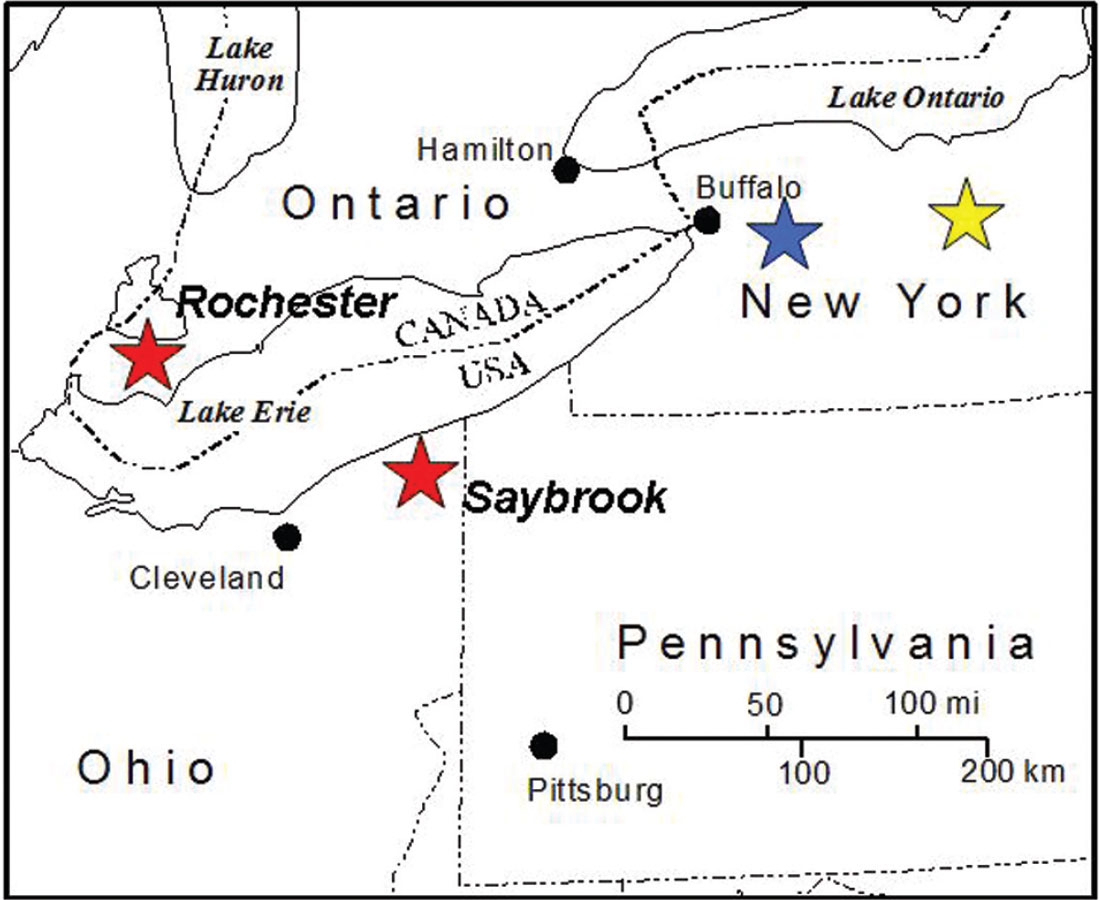
This paper summarizes how we integrated various types of 3-D seismic- and wireline log-based analyses to image fault networks and porosity in two Ordovician Trenton-Black River reservoirs, a gas-producing field (Saybrook) in Ohio and an oil-producing field (Rochester) in southern Ontario (Figure 2). By comparing these two areas, and integrating results from our other unpublished 2-D and 3-D seismicbased analyses of that interval from elsewhere in eastern North America, we hope to provide interpreters with tools and insights that may help them to explore for and develop analogous reservoirs elsewhere. More detailed descriptions of the Saybrook and Rochester studies are included in Sagan (2004), Sagan and Hart (2005), Ogiesoba (2008) and Ogiesoba and Hart (2009).
Our goals in these studies were two fold: 1) to provide field operators with maps that could be used to help evaluate any remaining potential in these areas, and 2) to examine relationships between faulting and porosity in order to develop genetic models that show how faults and associated fractures acted as conduits for hydrothermal fluids. We anticipate that the latter models can be used to evaluate analogous reservoirs elsewhere. Our results also provided insights into the workings of seismic attribute studies, and conveying those findings is one of the main objectives of this paper.
Methods
The primary data types available to us were digital wireline logs and stacked, migrated 3-D seismic volumes. We used the wireline logs to define relationships between porosity and lithology (crossplot analyses showed that all porosity was in dolomites, but that not all of the dolomites are porous), to define the stratigraphic location of porous units (porosity is primarily in the Black River interval in New York, but is present in both the Trenton and Black River intervals in our two study areas in Ohio and Ontario), and to generate zero-offset synthetics that were used to tie the wells to the seismic data. The 3-D seismic data were used to generate coherency and/or semblance volumes. The data from Ontario had a low signal-to-noise ratio and so a post-stack processing flow (described by Ogiesoba and Hart, 2009) was implemented prior to generation of these attribute volumes to reduce random and coherent noise (pre-stack data were not available). Next, we integrated post-stack attributes with log-based porosity (using neural networks and methods described by Hampson et al. 2001) in order to predict the distribution of that property away from well control. Finally, and inasmuch as our data permitted, we compared our results with engineering data not otherwise used in our work.
As an academic group we knew that we would not be drilling to test our predictions. We therefore decided to consider our analyses valid if the following conditions were satisfied: a) faults mapped in the 3-D volumes made sense from a tectonic perspective, b) there were valid explanations for why the attributes we used to predict porosity would be related to that property, c) the predicted relationships between porosity and fault networks made geologic sense, and d) our analyses adequately explained observed production trends.
Seismic analyses
The coherency data allowed us to map out different types of fault networks in both of our 3-D surveys. Faults in the Ohio data volume form a positive flower structure, consisting of an upward-branching network of faults that show an en echelon pattern at any given stratigraphic level. The fault network implies a combination of strike-slip movement and some compression (“transpression”), but overlaps of the en echelon faults would form relatively small (maximum a few 100 m in width) extensional settings where the upward movement of dolomitizing fluids might be possible. The faults in the Ontario data volume form an en echelon series of grabens, suggesting extension with relatively minor strike-slip movement (“transtension”). In both cases, the faults do not extend much above the top of the Trenton, suggesting that they formed in response to tectonic forcing shortly after deposition of that unit (i.e. during the Taconic Orogeny). Also, in both cases the fault networks that affect the Trenton-Black River interval are thought to be related to reactivation of older basement structures.
Our attribute studies identified various combinations of attributes that allowed us to predict the distribution of porosity in the Trenton-Black River interval away from existing well control. The following attributes were used in the Ohio study:
- RMS amplitude
- Perigram
- Reflection strength
- Derivative of reflection strength
- Integrated trace
- Cosine of instantaneous phase
The following attributes were used in the Ontario study:
- Reflection strength
- Energy half time
- Q factor
- Filter 15-20-25-30
- Cosine of instantaneous phase
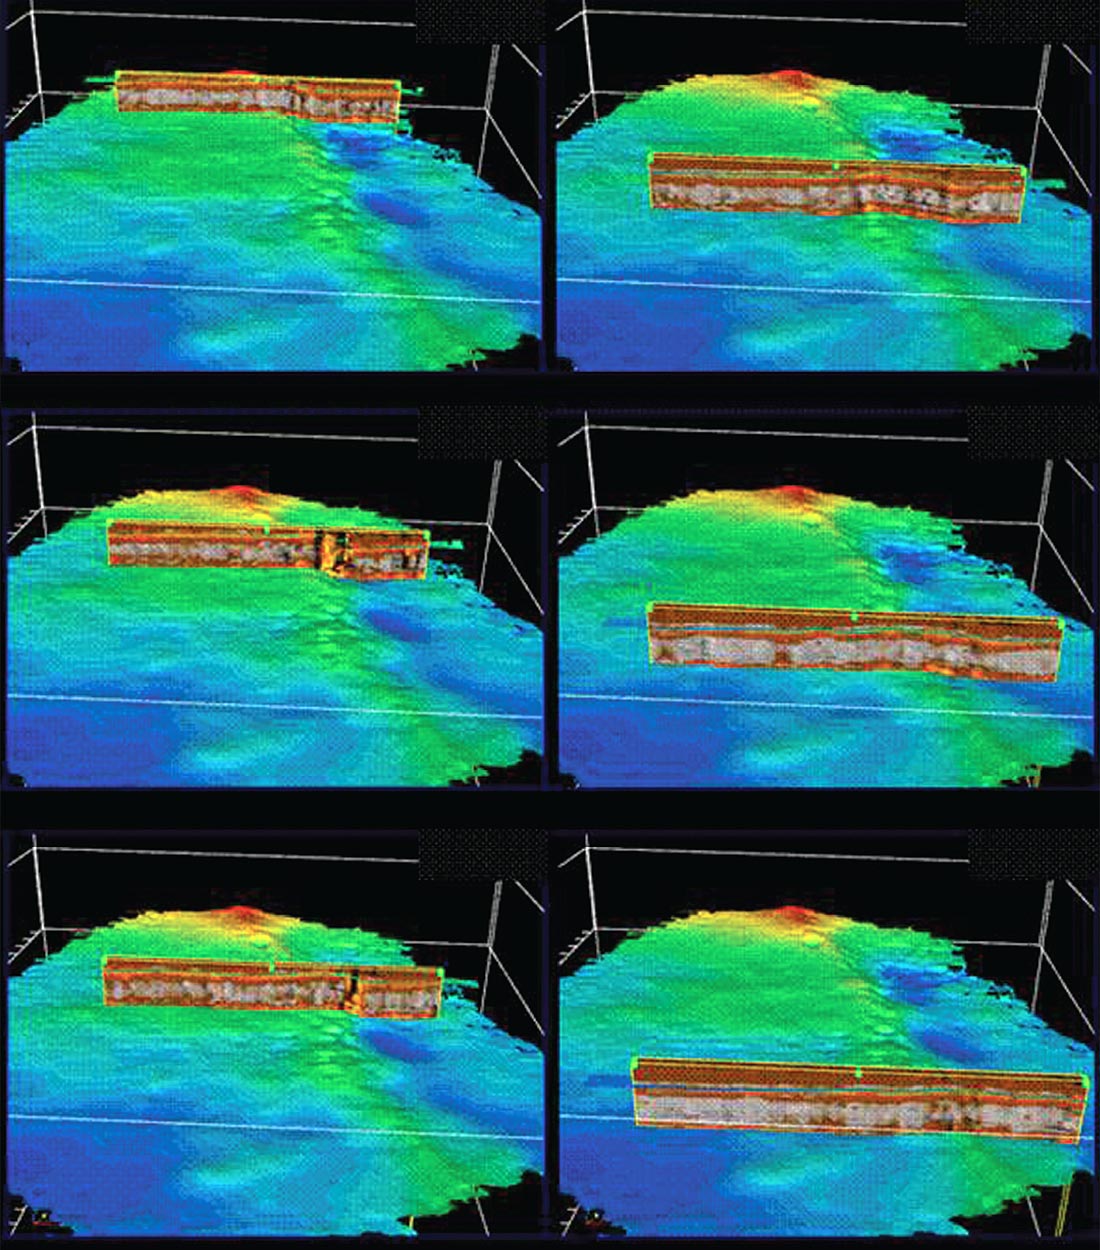
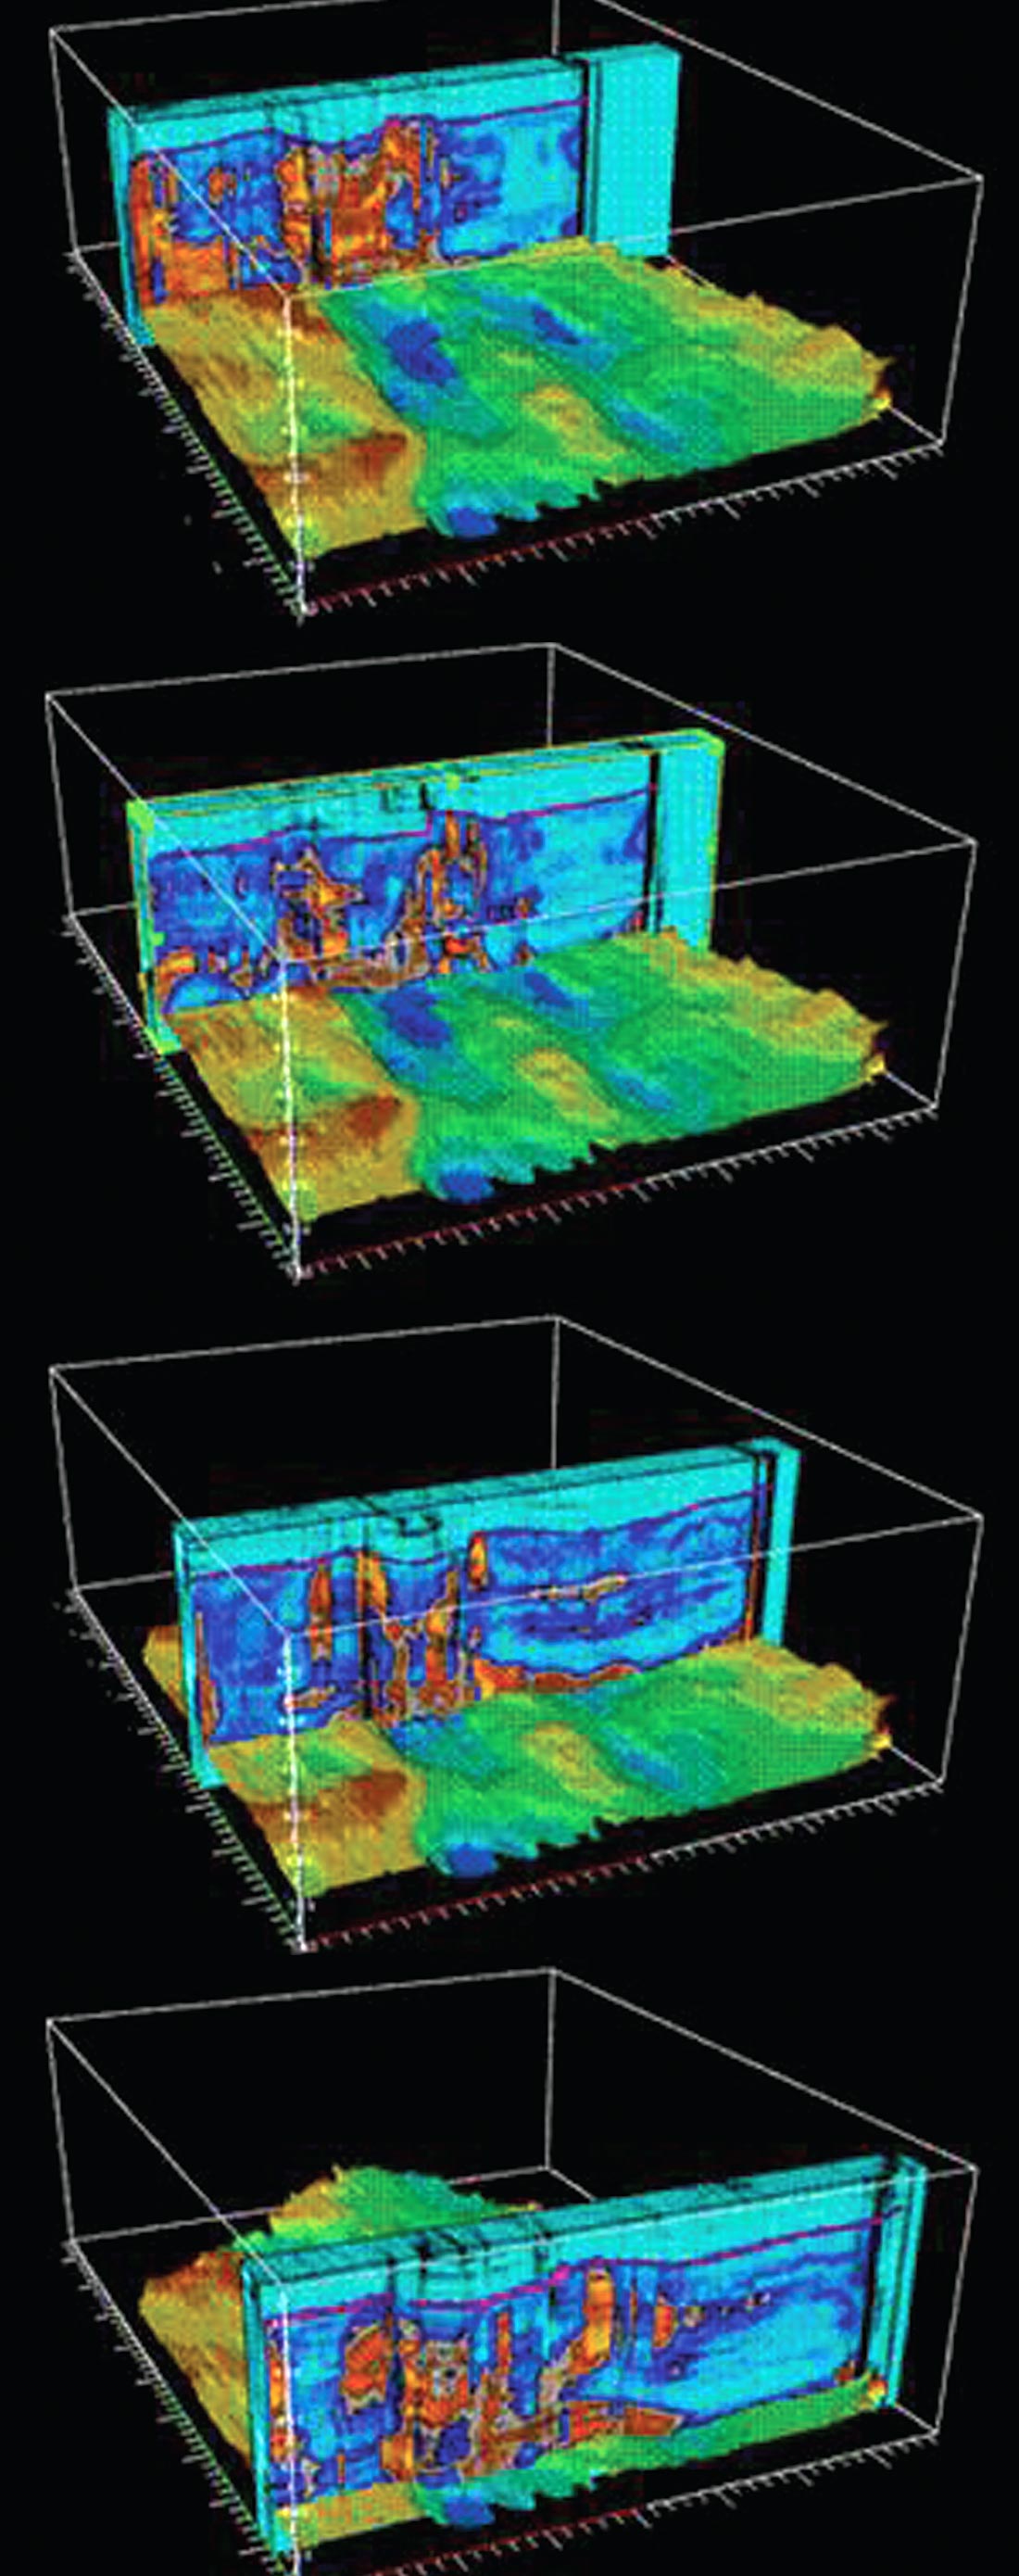
The attribute-based prediction showed that porosity in the Ohio data volume is preferentially developed in the overlap areas between the steeply dipping en echelon faults of the positive flower structure (Figure 3). As noted previously, these are the areas where extension would be expected, and open fracture networks in these areas would allow the upward movement of dolomitizing and porosity-generating fluids. Porosity is also preferentially associated with the largely extensional faults in the Ontario data (Figure 4), but we predict lateral and vertical variations in its distribution that are not easily explained. Nevertheless, our porosity prediction explains historical drilling and production results, and is corroborated by observations from horizontal wells that were not included in the attribute study.
The hydrothermal dolomitization diagenetic model is complex, and not universally accepted even among carbonate diagenesis experts. Therefore results such as ours provide useful insights that can be used to help guide the exploration and development of analogous reservoirs elsewhere. The two studies presented here indicate that strike-slip faulting, combining some variable component of extension, was conducive to the development of hydrothermal dolomitization and associated porosity. The porosity is generally closely associated with the faults, but in some areas there appear to be stratigraphic controls on porosity development that could not be adequately addressed with our data sets. In neither case would 2-D seismic data have allowed the structure or the porosity to be adequately mapped. Although 2-D data, perhaps integrated with aeromagnetic or other data, might be useful for identifying the presence of prospective structures, 3-D seismic data are needed in order to properly develop these features.
What do the attributes mean?
The attributes identified in the two studies are useful for identifying the porosity zones for one or more of the following four possible reasons: A) They are “physically significant attributes” that are related to acoustic impedance or acoustic impedance contrasts. B) They are “stratigraphically significant attributes” (Hart, 2008) which capture some aspect of waveform shape that is related to the vertical distribution of porosity. C) They are related to attenuation, the loss of frequencies in the interval. D) They are related to how the data stack in areas of complex geology. As described below, any one attribute might be related to porosity for a combination of reasons.
Attributes such as reflection strength, RMS amplitude and integrated trace are physically significant attributes in that they are related to acoustic impedance or acoustic impedance contrasts. For example, the integrated trace attribute is a simple estimate of relative acoustic impedance. Inspection of the 3-D surveys described in this study, and results of unpublished work on 2-D data, indicate that the integrated trace attribute is a useful qualitative indicator of porosity development in an interval. Reflection strength too consistently seems to be a good qualitative indicator of porosity development in 2-D (unpublished data) or 3-D seismic images of hydrothermal dolomite systems, and was an attribute identified as being important for making in wavelet shape that capture vertical and lateral changes in bed thickness or physical properties that are related to depositional or diagenetic processes. Interference between adjacent reflections causes the waveform to deform in ways that can be captured by some attributes. He used simple seismic models to show that attributes such as amplitude-weighted cosine of phase, 2nd derivative and others can be useful for identifying portions of the seismic data that are related to layers of specific physical properties. We suggest that in our two studies the cosine of phase and energy half time are stratigraphically significant attributes that are useful for detecting the location of porous zones in the hydrothermal dolomite systems imaged by our seismic data. Even reflection strength and RMS amplitude can be considered “stratigraphically significant” in that seismic amplitudes will be reduced for closely spaced thin beds (such as some of the porosity zones in our studies) because of destructive interference.
Instantaneous Q factor is an estimate of attenuation, which can be affected by fractures such as those thought to be present in most hydrothermal dolomite systems. The derivative of reflection strength is a measure of the rate of change of that attribute, which may be affected by faulting and fracturing (Taner, 2001). Pearson and Hart (2004) found that the “slope from peak to maximum spectral frequency” attribute, another measure of how frequencies are lost in an interval, was related to porosity in their study of the Ordovician Red River Formation in the Williston Basin. The Red River is another carbonate unit in which porosity is related to dolomitization and fracture development (although the dolomitization and porosity development in the Red River is not typically considered to be of hydrothermal origin). Together, these empirical observations suggest that attributes which are related to attenuation can be useful for identifying the fracture networks commonly associated with hydrothermal dolomite systems. Unfortunately, these attenuation effects could not be modeled using the types of acoustic seismic modeling packages available to us and so we recommend this as an avenue of future research.
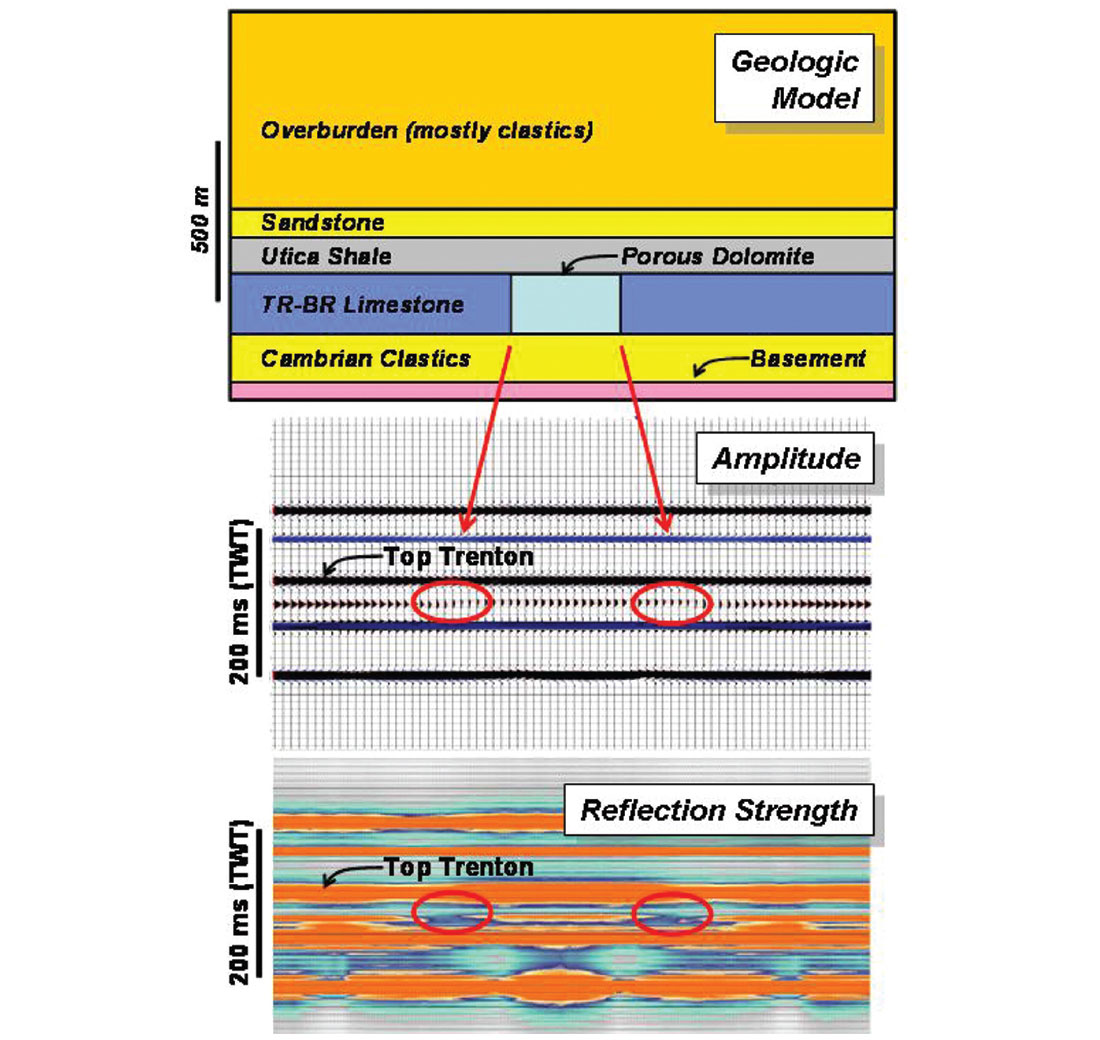
Finally, we note that stacking effects in areas of complex geology can be influencing attributes such as reflection strength. Figure 5 illustrates one such example. The geologic model at top in that figure illustrates a geologic setting which has relatively lower velocity and density porous dolomites surrounded by faster and denser tight limestone, a simplified geometry intended to represent hydrothermal dolomite fields similar to our Ontario example. We “shot” this geologic model using a ray-tracing package, and then processed those synthetic data to produce the stacked section shown in the middle of Figure 5. The image at bottom shows a reflection strength version of the seismic image. Note that reflection strength is reduced along the faulted margins of the structure. Our modeling showed that this is because reflections and raypath bending along the approximately vertical interface between the different units leads to poor stacking of reflection events in CMP gathers from these areas. Porosity in hydrothermal dolomite systems is commonly developed along the faulted graben margins (e.g. Figures 1, 4), and so it is tempting to equate lowered reflection strength along faults with porosity development. However, the porosity in the model is evenly distributed throughout the central graben, whereas reflection strength is only lowered along the margins of that structure. Clearly, there is no simple relationship between porosity and that attribute, although without the porosity in the graben center there would be no reflection strength anomaly.
The results presented here, combined with similar studies of other reservoir types (e.g., Hart, 2002; Hart and Chen, 2004; Marroquin and Hart, 2004) provide insights into the workings of seismic attribute studies. Statistics-based multi-attribute methods find complex relationships between a combination of attributes and physical properties in n-dimensional space, where n is equal to the number of attributes. The attributes are empirically weighted to provide the best result, and capture the sometimes subtle variations in waveform shape that correspond to the property of interest. In a purely empirical study, the reason for the relationship between each of the attributes and the physical property of interest is unimportant. The attribute might be physically significant, stratigraphically significant or, unfortunately, the relationship between the attribute and the physical property of interest might be spurious. Seismic modeling and other approaches are needed to help understand which attributes are truly useful.
The examples presented here help to demonstrate these points. For example, reflection strength can be associated with porosity in hydrothermal dolomite reservoirs for a variety of reasons, some of which are described above. However, the modeling presented in Figure 5 demonstrated that reflection strength, by itself, is not an unambiguous indicator of porosity. Other attributes need to be combined with reflection strength to better identify and quantify porosity. The process can be partially understood using set theory, in that porosity could hypothetically be associated with low reflection strength, high cosine of instantaneous phase, and moderate values of integrated trace (i.e. an intersection set). However, the multi-attribute approach permits numerical prediction of a physical property, and the relationship between an attribute and a physical property can be strongly non-linear, even for simple geologic settings (e.g. Hart and Chen, 2004).
Conclusions
The approach documented in this paper, which integrates structural interpretation and attribute-based porosity prediction, has proven to be a useful tool for characterizing hydrothermal dolomite reservoirs. These reservoirs appear to be best developed where a combination of strike-slip movement and extension allowed dolomitiizing and porosity-generating fluids to migrate along fracture networks into tight limestone. The lateral and vertical distribution of porosity, and faulting, is complex and cannot adequately be mapped using 2-D seismic data.
The two studies presented herein, combined with our other unpublished and published results, suggest that post-stack attributes can be useful for detecting and quantifying porosity development in hydrothermal dolomites. Some of the attributes have physical significance (i.e. they are related to impedance), some of the attributes have stratigraphic significance (they are related to the stratigraphic organization of impedance/porosity), and some appear to be related to attenuation (perhaps by fractures). Stacking effects in areas of complex geology, like those of the hydrothermal dolomite reservoirs discussed here, also appear to have an impact on some seismic attributes.

Acknowledgements
We thank Talisman for providing data, partial funding and technical insights for the Ontario study, and CGAS for providing data for the Ohio project. Other funding was provided to the senior author by the Natural Sciences and Engineering Research Council.
Related Reading


Join the Conversation
Interested in starting, or contributing to a conversation about an article or issue of the RECORDER? Join our CSEG LinkedIn Group.
Share This Article