Coherence Cube™ Imaging1
Coherence Cube imaging essentially generates a cube of coherence coefficients (from the input 3D seismic data volume) that portrays faults and other stratigraphic anomalies clearly on time or horizon slices. These images show up distinctly, depicting buried deltas, river channels, reefs etc. Traditional seismic time slices are often used for interpreting faults that run perpendicular to strike. However, when faults run parallel to strike, they become difficult to interpret as fault lineaments become superimposed on bedding lineaments. Similarly, the remarkable detail of stratigraphic features such as river channels, mud flows and submarine canyons are unidentifiable even with close scrutiny.
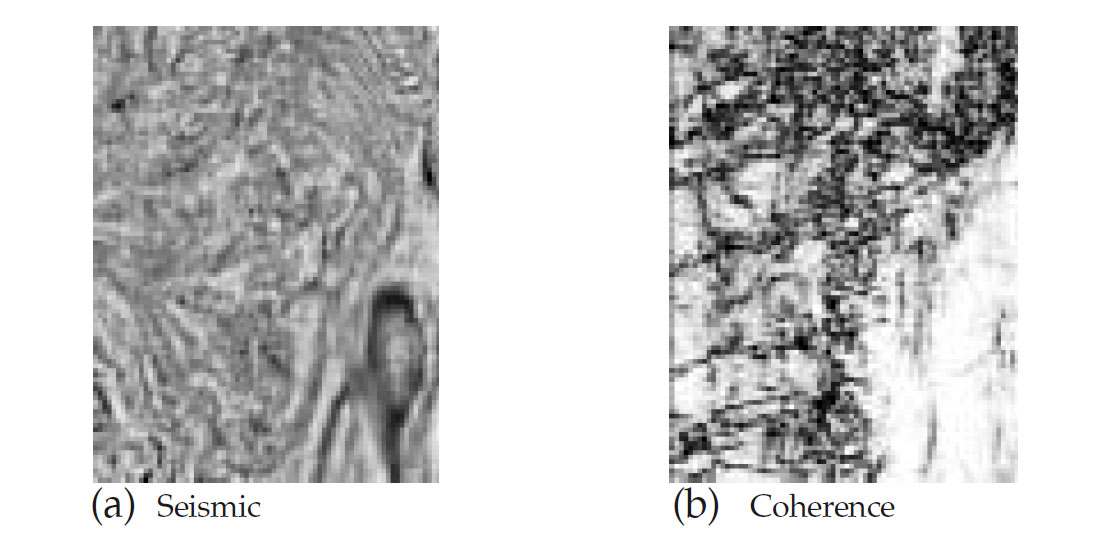
Coherence measurements in three dimensions represent the trace-to-trace similarity and therefore produce interpretable changes. Similar traces are mapped with high coherence coefficients and discontinuities have low coefficients. Regions of seismic traces cut by faults for example, result in sharp discontinuities of trace-to-trace coherence, producing delineation of low coherence along fault planes. Since the three-dimensionality is an essential ingredient of coherence computation, faults or fractures in any orientation are revealed equally well[1-6]. Fig.1 depicts an example for Cook Inlet area of Alaska where faults and fractures, apparently difficult to interpret on the seismic, show up clearly on the coherence slice.
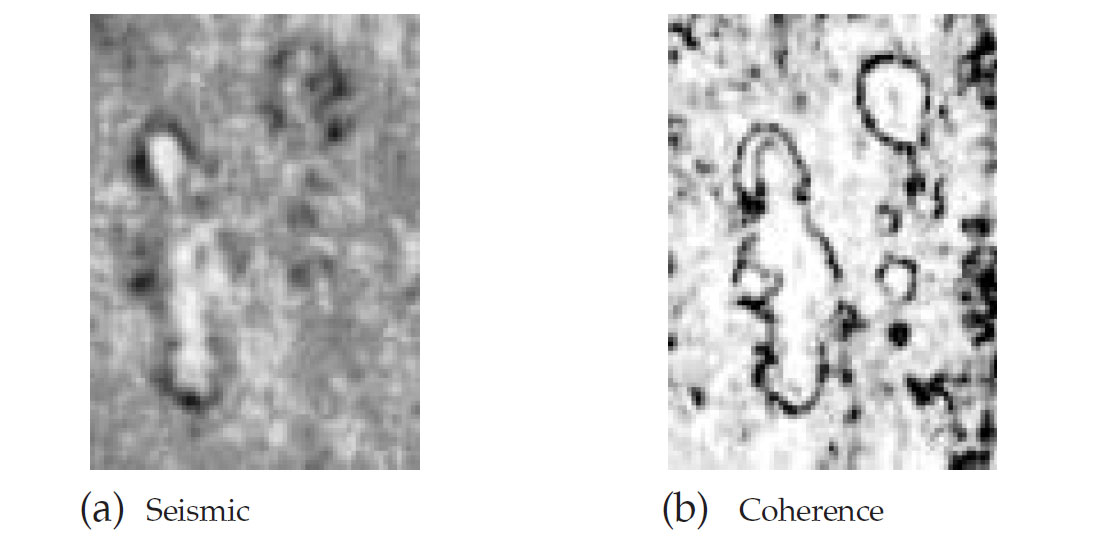
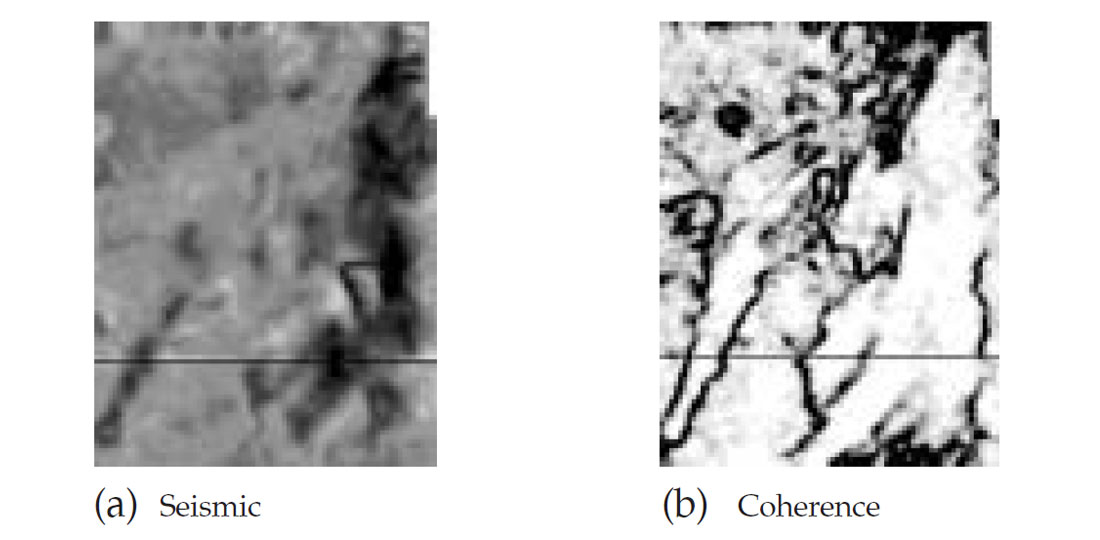
Stratigraphic features generate similar discontinuities resulting in sharp detection of reef and channel boundaries (Fig.2 and 3) and deltaic sediments. Consequently, in addition to faults, channels, beaches, coherence cube has been successfully used for easy visualization of mud volcanoes, mass wasting, dewatering features and other features. An attractive characteristic of coherence cube is that it gives an unbiased view of the features in the seismic volume.
Integrating Coherence Cube and Seismic Attributes (a) Complex Trace Attributes
Complex trace seismic attributes [7] include measure of seismic amplitude, frequency and phase and have been successfully used in mapping lithology changes in the last two decades. During computation of coherence, it is possible to obtain a more smooth and robust multi-trace estimate of the complex trace attributes [2].
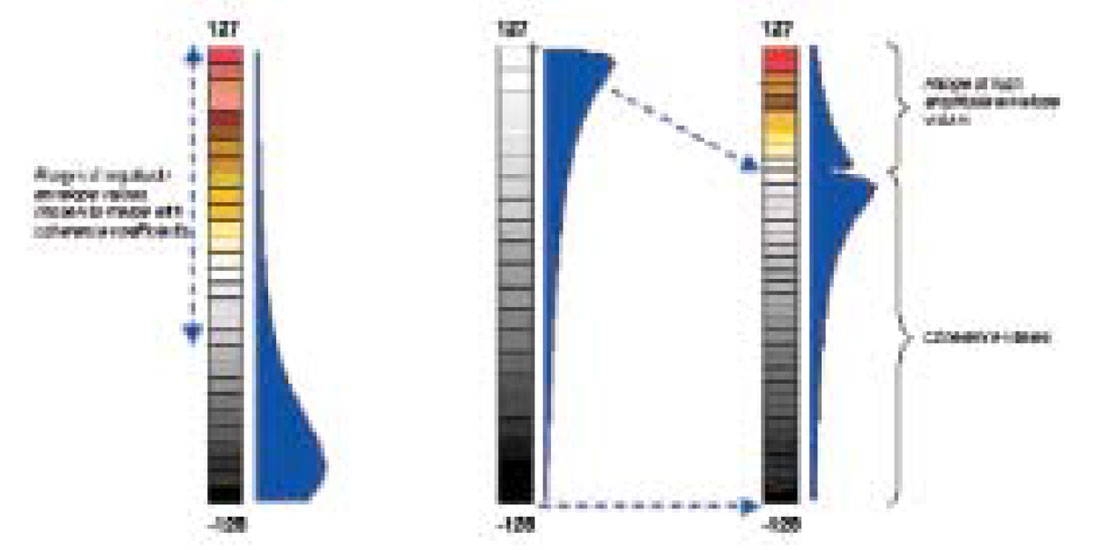
Composite Displays: While such attributes volumes can be used individually, it is possible to generate convenient composite displays. Occasionally, on coherence slices, one encounters high coherence envelope amplitudes within channels, point bars or reefs. For ease in identification and corroboration, another coherence volume is created which has the coherence coefficients in tact, but the high-end amplitudes from the coherence envelope volume are overlayed on it. Fig.4 illustrates how the high end of amplitude envelope values is merged with coherence coefficients.
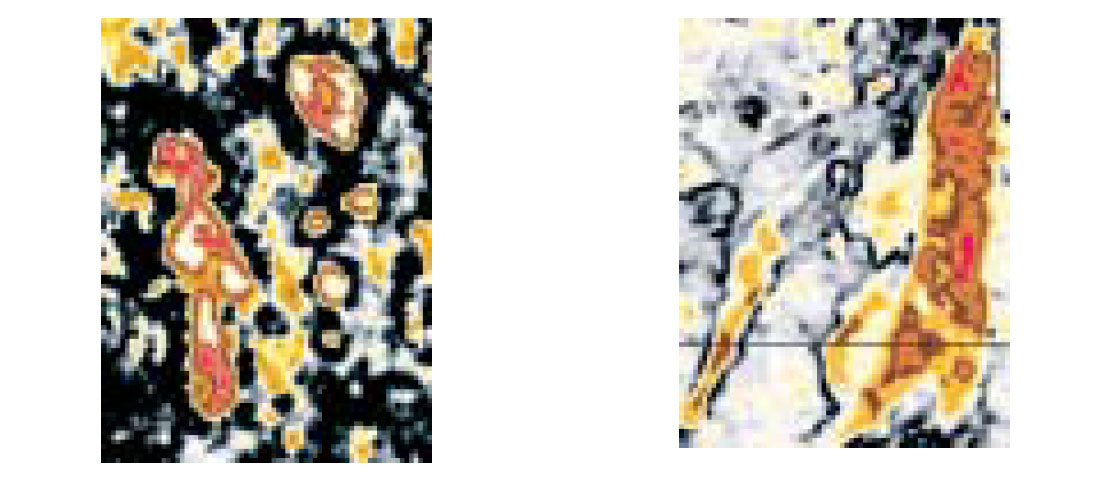
The high envelope amplitudes corresponding to the events of interest stand out as ‘bright spots’ on coherence slices. Fig.5 shows the composite displays for the reef and channel features shown in Fig.2 and 3. Such displays help in identification of the nature and extent of depositional features but also help in gaining understanding of depositional environment.
(b) Impedance attribute
Seismic inversion for acoustic impedance is widely used in the industry today mainly due to the ease and accuracy of interpretation of impedance data [8]. Also, inversion of seismic data to acoustic impedance allows an integrated approach to geological interpretation.
Seismic data represent an interface property wherein reflection events are seen due to relative changes in acoustic impedance of adjacent rock layers. The observed amplitude changes, however, may not indicate if the amplitude changes relate to lithology variations above or below an interface. Acoustic impedance is a physical rock property, given as the product of density and velocity. Well logs measure both these entities directly, so that by dividing the density log by the sonic log, acoustic impedance log is obtained. Thus while acoustic impedance is a layer property, seismic amplitudes are attributes of layer boundaries. Now, if any quantitative interpretation of seismic data in terms of thin stratal interval properties (impedance) is to be attempted, then instead of the interface reflection properties, inversion is to be resorted to. Now acoustic impedance being a layer property, simplifies lithologic and stratigraphic identification and may be directly converted to lithologic or reservoir properties such as porosity, fluid fill and net pay. In such cases then, inversion allows direct interpretation of three-dimensional geobodies. Inversion plays an important role in seismic interpretation, reservoir characterization, time lapse seismic, pressure prediction and other geophysical applications. Several different techniques / methodologies [9-11] are commonly used to perform acoustic impedance inversion and entail different Fig.5: Composite displays depicting high end of envelope amplitudes superim- levels of sophistication, e.g. recursive inversion, model based inversion, sparse spike inversion, stratigraphic inversion, stochastic inversion. Whatever technique is adopted to invert the seismic data volume, the impedance volume proves to be very useful.
Composite Displays: The Coherence Cube offers a high resolution unbiased image of the variations within the volume, wherein geologic features and faults are enhanced. As stated earlier, the inverted seismic volume, e.g. the acoustic impedance volume exhibits an improved image of the impedance variations, which can be used for lithologic and stratigraphic interpretations. By integrating the coherence and impedance volumes, acoustic impedance changes can be readily identified within sedimentary systems, resulting in unparalleled detail of subtle sedimentary depositional features. Acoustic impedance results may be numerically combined with the coherence results, producing a volume that would allow the interpreters to display the stratigraphic images from the 3D seismic data and examine the acoustic impedance contrast across them. For example, sand deposition within a channel that is gas charged would exhibit low impedance. So, a range of low impedance representing the gas sands may be selected and merged with the coherence cube. The composite merged volume so generated may again be sliced through to see low impedance (in color) displayed within the boundaries of the channel.
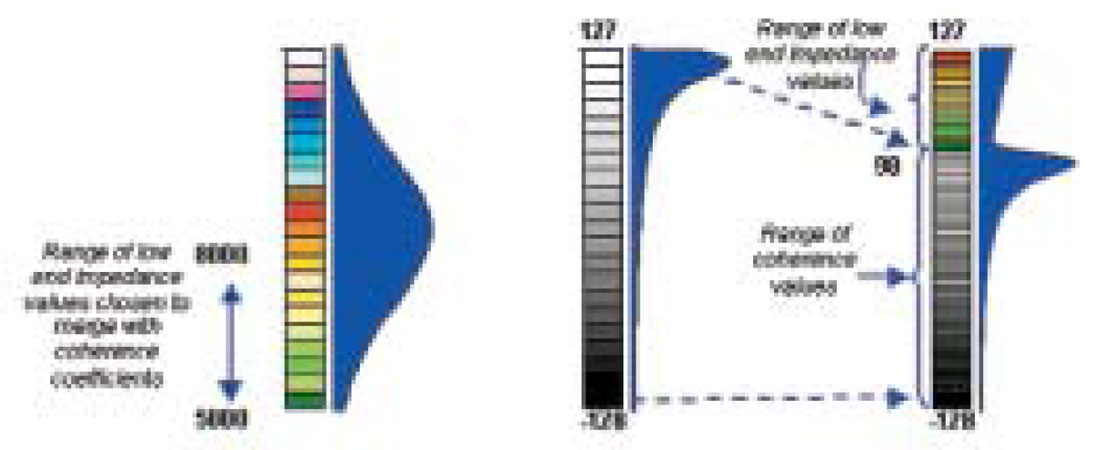
Fig.6 illustrates how the low end of the impedance range of values is cut off from the impedance volume and merged with the coherence volume.
Channel sand reservoirs are difficult to develop efficiently, but often they have excellent production characteristics. The depositional mechanisms involved in channels can create sand bodies whose thickness and quality can vary rapidly over short distances. Such rapid variations make it difficult to use conventional seismic data successfully for mapping. Impedance inversion helps in such cases. Fig.7(a) shows a coherence slice depicting two channels that stand out clearly in a high coherence background. The impedance slice(Fig.7(b)) indicates low impedance within the channels implying the presence of hydrocarbon bearing sands. However, the low end of the impedance can be merged with the coherence and stretched over a suitable scale (Fig.7(c)) to see the variation within the low end of the range of the impedance values chosen.
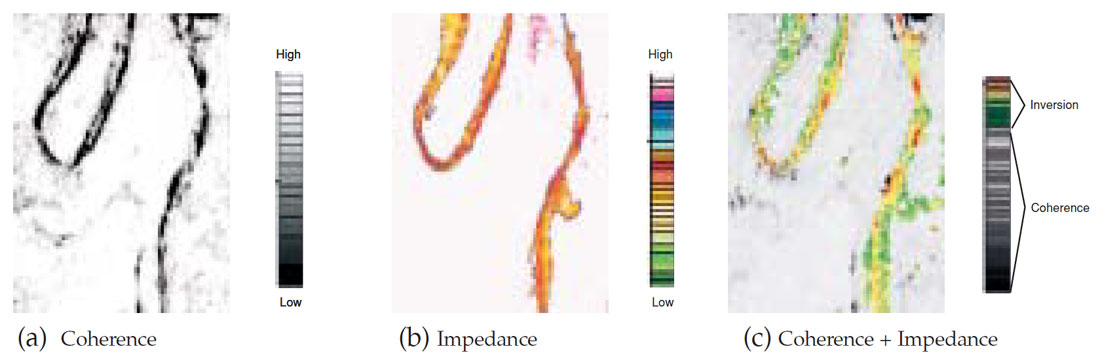
Such composite plots could be convincingly used to define precise reservoir and non-reservoir facies boundaries and reservoir compartments.

Acknowledgements
The author thanks Scott Pickford for permission to publish this paper.
1Coherence Cube is a trademark of Core Laboratories.


Join the Conversation
Interested in starting, or contributing to a conversation about an article or issue of the RECORDER? Join our CSEG LinkedIn Group.
Share This Article