Introduction
Traditional AVO and petrophysical analysis extract and exploit anomalous variations between seismic compressional wave velocity (Vp) and shear wave velocity (Vs) to indicate changes primarily in pore fluid, as well as lithologic properties (Gassmann 1951, Pickett 1963, Tatham 1982, Castagna 1993a). Other analysis methods using seismic measurements derive Poisson's ratio formulated from (Vp/VS)2 (Ostrander 1984) or P and S reflectivities, ie. impedance contrast (Gidlow et aI. 1993, Fatti et al. 1994 Wallace & Young 1996). The underlying emphasis on seismic velocity and density arises from the Knott-Zoeppritz equations for continuity of displacement (u) and stress (σ (u)) across an interface between different rock properties for a propagating seismic wave. Displacement and stress are usually derived from a plane wave solution of the acoustic wave equation; u = Aeiωl(t-x/V) However the underlying physics in the wave equation; d2u/dx2= ρ/M (d2u/dt2) does not involve seismic velocities, but instead the ratio of density (ρ) to modulus (M). So converting velocity measurements to Lame's modulii parameters of rigidity (µ) and incompressibility (λ) offers new insight into the original governing rock property factor ρ/M. It will be shown that an improved identification of reservoir zones is possible by the enhanced sensitivity to pore fluids from pure compressibility, as well as lithologic variations represented by fundamental changes in rigidity, incompressibility, and density parameters as opposed to mixed parameters of seismic velocities.
Theory, method and log analysis motivation
Standard analysis methods given above, though appearing different, rely fundamentally on Vp, Vs and density variations, thereby masking the original modulus parameterization as mentioned. Some authors point out the need for a more physical insight afforded by rigidity µ (Wright 1984, Thomsen 1990, Castagna et aI. 1993b) in the above equations. Castagna also indicates that the link between velocity and rock properties for pore fluid detection, is through the bulk modulus κ that is embedded in Vp. However both κ and more so Vp have the most sensitive pore fluid indicator A diluted by varying factors of the rock matrix indicator (ie. nonpore fluid). This can be seen in the following relationships; Vp2 = (A + 2µ)/ρ = (κ+ (4/3)µ)/ρ and VS2= µ/ρ.
Recent AVO inversion schemes incorporate an explicit density term (Stewart 1995, Smith 1996) to potentially extract modulii, but as the number of unknowns increase and exceed the measured quantities (intercept and offset gradient amplitude) so these complex equations are less robust and the extracted values more inaccurate. From these observations the standard approaches may be considered either too insensitive or unnecessarily complex as rock property indicators.
The proposal here is to use modulii/density relationships to velocities V or impedances I, given as; Ip2 =(Vp. ρ) = (λ + 2µ)ρ and Is2 = (Vs. ρ)2 = µρ, in order to extract the orthogonal Lame parameters λ and µ, from logs with measured density ρ, or λρ and µρ, from seismic without known density. The simple derivations are; λ =Vp2. ρ - 2Vs2.ρ, µ =VS2.ρ, and λρ = Ip2- 2 Is2, µρ = Is2.
Note, Poisson's ratio analysis being related to (Vp/VS)2, comes closes to measuring the most "rock property sensitive" modulii ratio of λ/µ (i.e. (VpVS)2 = (λ/µ) + 2). Unfortunately the constant 2 in the equation is of the same order as the λ/µ ratio thereby reducing the full impact of the relative change of this ratio between different rock properties. Incompressibility λ is however non physical unlike rigidity µ, but the extraction method can be seen as a form of stripping off the µ sensitive rock matrix to reveal the most sensitive pore fluid indicator λ.
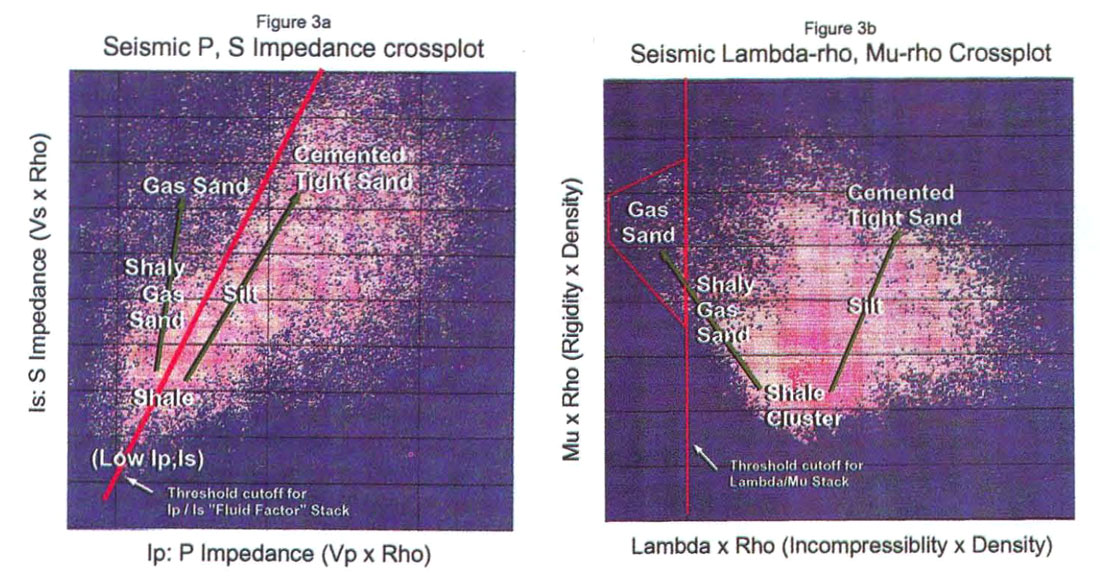
Table 1, shows the justification and power of the method in petrophysical analysis. Actual Vp, Vs and ρ values from a shallow gas well (not in the study area discussed later) have been combined to give various rock property values and average % change i.e. contrast at the interface for detectability. The unusual behaviour of a very limited ΔVpVp compared to ΔVsVs for this thick, good quality gas sand zone requires some explanation, as most standard measurements concentrate on this non-responsive Vp change. The answer lies in comparing columns 4 to 7, where it is apparent that because of Vp's dependence on both λ and µ, the effect of decreasing A (incompressibility) as a direct response of the gas porosity, is almost completely offset by an increase in µ (rigidity) in going from capping shale to gas sand. However by breaking out A from Vp and combing it into a λ/µ ratio, the average changes of 70% for A and 110% for λ/µ are by far the most sensitive to variations in rock properties going from shale to gas sand. The best conventional measurements from Poisson's ratio (σ) of 45% and (VpVs)2 of 55% are far less sensitive. This λ, µ analysis works well for log data, however for surface seismic without an independent measurement of density, the extraction of λ and µ is not possible with any certainty.
For seismic data, a common starting point for AVO analysis is the simpler linearized approximation to the Knott-Zoeppritz equations given by Aki and Richards (1979 p. 153). This equation can be reformulated in terms of modulii and density as;

Though this equation has some merit in revealing the AVO variation for modulii and a totally independent ρ term, it is not practical for AVO analysis. A modified equation to extract P and S reflectivities or impedance contrasts, given by Gidlow et al. 1992, Fatti et al. 1994, is used instead, where the last term in ρ only, cancels for most VpVs ratios around 2 and small angles;

Having extracted the P, S reflectivity sections, the next step is to obtain Ip and Is through inversion. Finally by using the (modulii x density) to impedance relationships given above, extraction of λρ and µρ is possible. Results of this method on synthetic, prestack AVO models derived from subtle changes in carbonate rock properties, show significant improvement in DID detectability over the conventional analysis based on VpVs or Ip, Is, variations.
Case study log analysis and seismic AVO
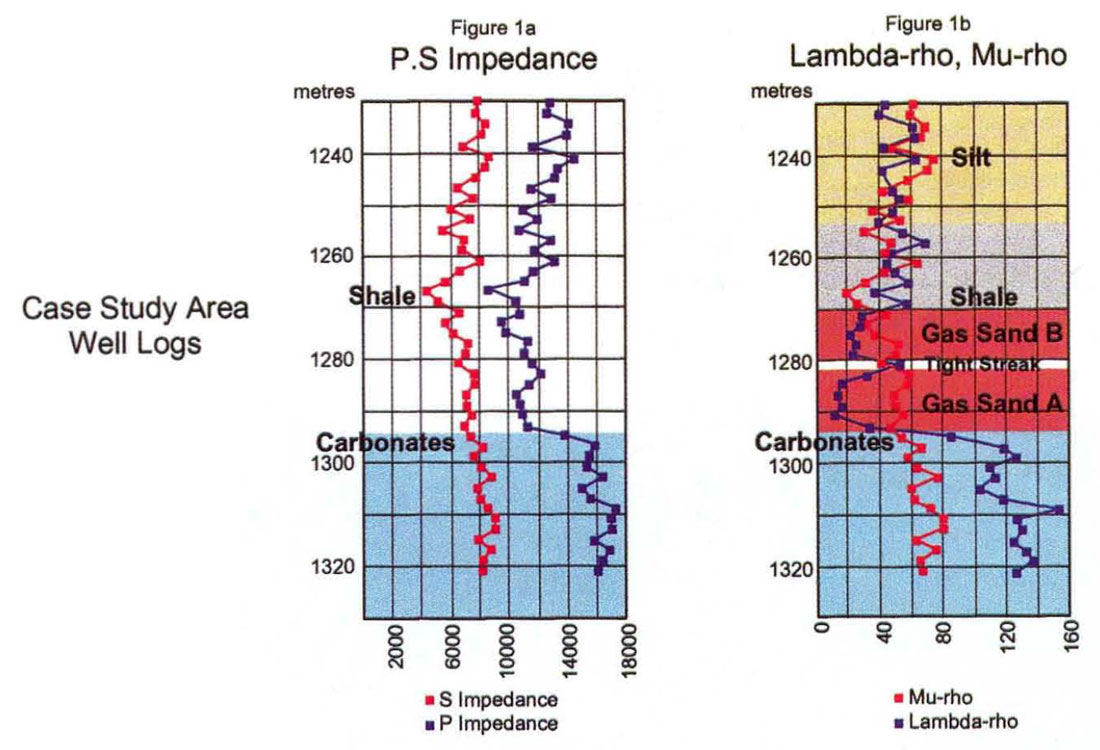
Fig. 1, shows gas logs in depth from the study area where a conventional Ip v's Is analysis (1a) has limitations in clearly discriminating between all the various lithologic and gas sand zones (eg. gas A with VpVs of 1.5 is just discernible). Because Ip and Is share both rigidity and density the log curves tend to track each other and never crossover, with only the lowest impedance shale or highest impedance carbonate zones being clearly distinguishable. By contrast the λρ and µρ curves (1b) have similar value ranges, that do crossover with λρ < µρ for gas zones (note, gas zone A has a better poro-perm than zone B as shown by the wider separation of the curves in zone A), while λρ > µρ is an excellent indicator of thin, tight shale breaks as seen separating gas zone A from B, as well as the capping shale above gas zone B.
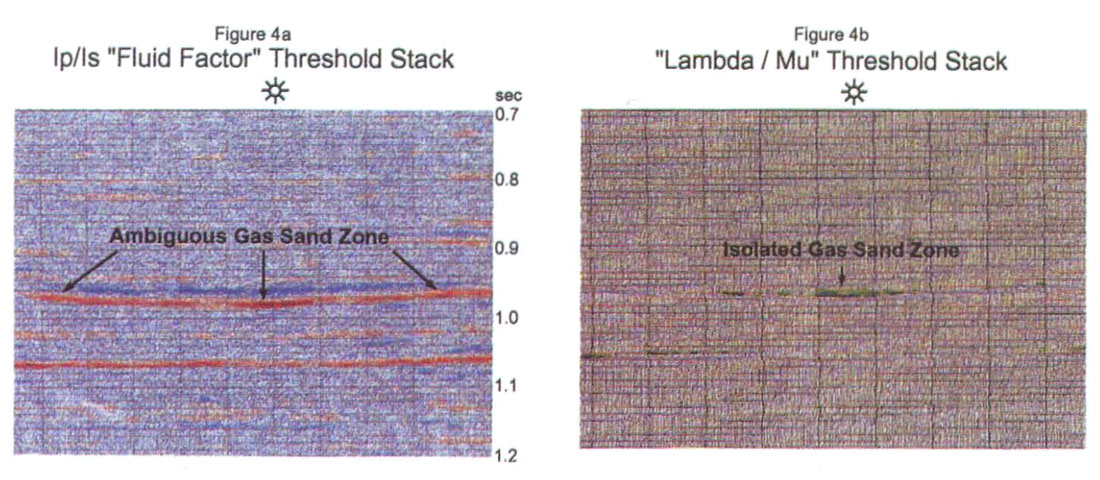
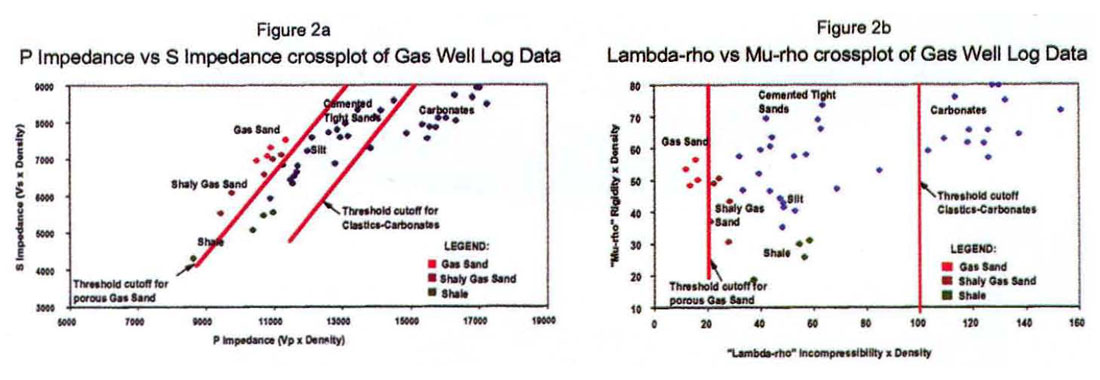
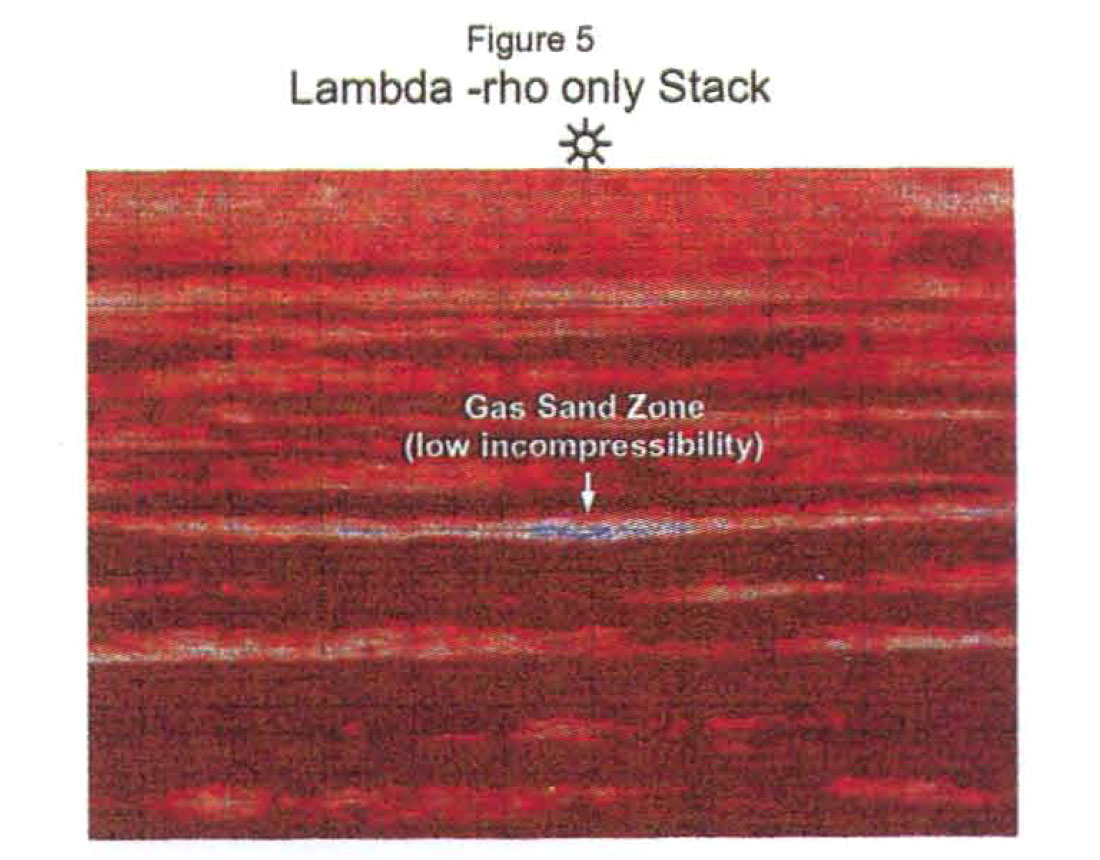
AVO analysis requires crossplotting Ip, Is or in this new approach λρ, µρ for a "fluid factor" (Smith & Gidlow 1987) or threshold type stack that isolates only the anomalous gas zones from background relationship. Figs. 2a, b, compare the Ip, Is to λρ, µρ crossplots, with λρ, µρ showing a significant advantage in isolating both lithologic properties, ego sand, shale, and carbonate facies as well as gas zones. The Ip, Is points in Fig. 2a, cluster in a close linear relationship (hence Castagna's mud-rock line) with shale having the lowest values on both axes. By contrast in Fig. 2b, the lowest λρ (incompressibility x density) point has the best gas sand values along with µρ (rigidity x density) values higher than shales. Simply put, for the Ip, Is plot all rock types plot to the upper right direction from the lowest shale values, while for the λρ, µρ plot the anomalous gas sands are in the upper left hand quadrant from the lowest µρ shales while other more competent pure lithologies (silts, cemented sands) plot in the opposite upper right quadrant relative to the shales. The reason for the separation improvement in 2b, compared to 2a, is that the λρ v's µρ axes are orthogonal with regard to modulii, unlike Ip v's Is, thereby making the crossplot more discriminating. This difference is better seen between figs. 3a and 3b, showing the equivalent crossplotted results from a seismic line through the gas well. By being able to clearly identify the upper left quadrant of the λρ, µρ crossplot as good gas sands unlike the tighter Ip, Is crossplot scatter, the resulting "fluid factor" stacks in Figs. 4a v's 4b, show the improved discriminating power of the new λρ, µρ approach. Fig. 4b, has the gas zone only shown plotted in green on wiggle traces of P impedance, while the Ip, Is "fluid factor" stack has numerous ambiguous gas zones that are false. Finally a pure λρ (incompressibility x density) stack in Fig. 5, shows clear isolation of the gas zone in blue, sandwiched between higher λρ zones both for the overlying shale and underlying carbonates as predicted by logs.
Conclusions
1) Improved petrophysical discrimination of rock properties using λρ, µρ over conventional Vp, Vs analysis.
2) Greater physical insight by isolating reservoir rock properties for pore fluid and lithology, into the modulin or Lamé parameter terms of their seismic responses
3) Easier AVO crossplot thresholding for a more sensitive "λρ, µρ fluid factor" type stack.
4) A new pure λρ (incompressibility x density) stack showing gas zones without interpretive thresholding or fluid factor choices.


Join the Conversation
Interested in starting, or contributing to a conversation about an article or issue of the RECORDER? Join our CSEG LinkedIn Group.
Share This Article