Is the reported global warming of the 20th century really due primarily to increased concentrations of carbon dioxide (CO2) in the earth’s atmosphere from human activity? Apparently not!
There is an increasing body of scientific evidence coming from the astronomical community and other scientists, that indicates that variations in solar activity may be the most significant factor responsible for recent global warming.
Many scientific papers have been published during this decade dealing with the apparent sun-climate connection in some of the top scientific journals, such as The Astrophysical Journal, The Journal of Atmospheric and Solar-Terrestrial Physics, and Geophysical Research Letters, just to name a few.
It is almost amusing that the scientific name for the amount of radiant energy, within the spectral band that includes infrared, visible and ultraviolet light, that the earth receives at the top of its atmosphere from the sun perpendicular to the direction of the sun at the mean earth-sun distance, is the “Solar Constant” and its value is apparently about 1372 watts/sq.m. But satellite observations of it over the past twenty or so years have shown that it is in fact not “constant”, but that it does vary slightly from year to year and does so roughly in-phase with the 11-year cycle of solar activity . Also very interesting is the fact that the amount of energy incoming from various parts of the light spectrum vary quite differently than others during the cycle, Fontenla (1998). The total amount of this incoming radiant energy at any particular time is called Total Solar Irradiance (TSI). Some climate modeling work has been published that indicates that a 2% increase in solar heating would be the equivalent of doubling the CO2 concentration in the earth’s atmosphere as far as global warming is concerned.
Shortly after Galileo built himself an optical telescope in 1609 and turned it toward the sky, he discovered, among many other amazing things, that the Sun had dark spots on its surface, that is once he found a way to look at it without blinding himself. These spots appear dark because they are significantly cooler than the rest of the “observable” surface, called the photosphere, and can occur alone or in sunspot “groups”. Soon after, observers began keeping detailed records of these sunspots and their numbers. Later, it was noted that the number of sunspots came and went with a fairly regular cycle with a period of about eleven years. That is, that for a year or two there would be few or no sunspots, the sunspot minimum, and then their numbers would grow reaching a peak in a few years, the sunspot maximum, before more gradually decreasing to basically none again at the end of the cycle. It has also been noted that there is a cyclical pattern to where individual sunspots form and later disappear on the sun’s surface during the eleven year cycle. When sunspots first begin to appear early in the cycle they are generally located at an average latitude of about 35 degrees north and south on the sun, then as the maxima approach they are generally located at lower latitudes and as their numbers drop off toward the next minima, and the end of the 11-year cycle, they are generally located at very low latitudes, ie. about 8 degrees north and south, very near the sun’s equator. The length in years of each cycle, as well as the maximum number of sunspots reached during each cycle maxima, also vary with time. The average length of the observed sunspot cycle is about 11 years, but it has been as short as 8 years and as long as 15 years. It has also been noted that the sunspot number time series has longer wavelength components contained within it, with cycles of about 80-90 years, 200 years and probably much longer. It was also discovered early this century that sunspots have a strong magnetic field associated with them and that the eleven year cycle is actually part of a roughly 22 year cycle when the polarity of this magnetic field is included, the magnetic fields associated with the sunspots flip polarity with each successive 11 year cycle. This 22 year cycle is referred to as the “solar magnetic cycle”. Obviously, all of these variations appear to be part of normal and natural cyclical variations in solar activity and much work continues to try to identify and understand the driving forces behind them.
A very strong correlation has been shown to exist between the length in years of the solar cycle plotted as a function of time and the observed mean land surface air temperature variations, globally over the last 100 or so years and for the northern hemisphere for the last few centuries, Lassen and Friis-Christensen (1995), and others. Also, a strong correlation has been found between the solar cycle lengths and global tree-ring growth data, Zhou and Butler (1998). A number of works have attempted to reconstruct TSI over the last 300-400 years, such as Lean et al (1995) and Hoyt and Schatten (1993). Others have looked at the sun-climate relationship itself, such as, Lean and Rind (1999), Soon etal (1996), and Baliunas and Soon (1996). Haigh (1999), provided an overview of climate modeling to date and indicated that proper modeling including all the variable components that result from solar variations is still in its infancy.
Figure 1 shows the reconstructed Combined Solar Irradiance Model and northern hemisphere temperature profiles from Hoyt and Schatten (1993). Note how similar these two curves are, particularly during the 20th century. Obviously the farther back in time we go the more uncertain the data will be. Hoyt and Schatten (1993) based this reconstruction on the length of the solar cycle and several other indicators of solar output. Figure 1 also shows the atmospheric CO2 concentrations for 1850-1980 for comparison. In my opinion it is very obvious from the curves in Figure 1 that this reconstruction of varying solar irradiance much more closely matches the variations in reported northern hemisphere temperatures, than that from increasing greenhouse gases during the above time period. In particular, see that from about 1945 to about 1970 both solar activity and northern hemisphere temperatures apparently fell, and the latter does not seem to correlate at all with the variation in atmospheric CO2 concentrations during this interval.
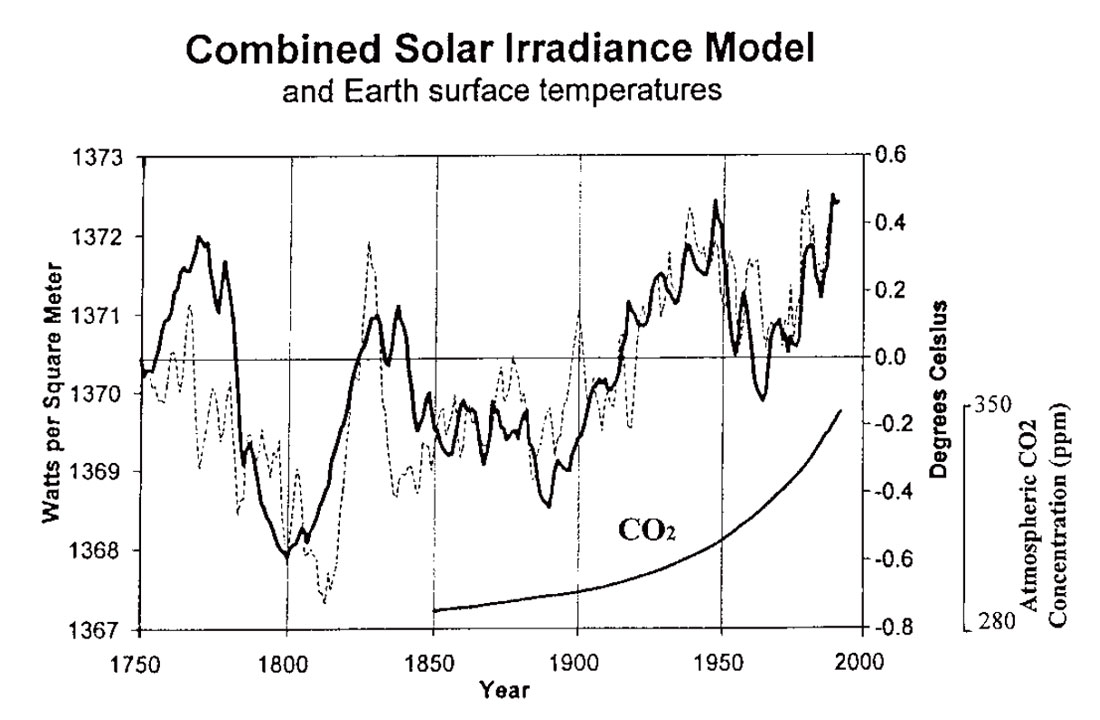
Figure 1: The annual mean northern hemisphere temperature variations for 1750 to about 1992, after being smoothed by an 11-year running mean, (dotted line) and the combined solar irradiance model (solid line), from Hoyt and Schatten (1993). Note the similarity of the these two curves, particularly during the twentieth century when the data should be the most reliable. Atmospheric CO2 concentrations for 1850 to about 1988 from Houghton and Woodwell (1989) are shown in the lower right for comparison. Note that atmospheric CO2 concentrations are shown to increase throughout this time period, including the interval from about 1945 to about 1970 when both the temperature and irradiance curves show a decline. Adapted from Hoyt and Schatten (1993).
In the best paper that I have come across thus far that demonstrates the apparent strength of the sun-climate connection, Soon etal (1996), the authors report on numerous energy-conserving climate model simulations that they did for the time period from 1880 to 1993 using four different total solar irradiance input profiles derived from various indicators of solar activity, input profiles for the contribution of greenhouse gases in general (GHG), and CO2 alone, separately and in various combinations. The model outputs were optimized by applying various stretching factors to the input profiles to obtain the best possible fit between predicted and observed global mean land surface air temperature variations for the above time period. In the six best fitting model results, 96, 94, 85, 78, 73 and 71 percent of the observed temperature variance for the above time period could be attributed to changes in solar irradiance alone. The first two of the above results were obtained from simulations that included total solar irradiance input alone and in combination with greenhouse gases in general (not just CO2), and these fits are very impressive. Figure 2 shows the best model result that included input from solar and greenhouse gases. As you can see in this figure, the match between predicted and observed temperature variations from this model result is incredibly good. However, since its stretched total solar irradiance profile did not conform to limits imposed by satellite observations of TSI over the past twenty or so years, the authors discarded it. Several other model results were discarded for the same reason. However, as reported in their conclusions, the best optimized model result that did fall within observational limits did include both solar and greenhouse gas contributions and indicated that 71 % of the reported global warming could be due to the Sun.
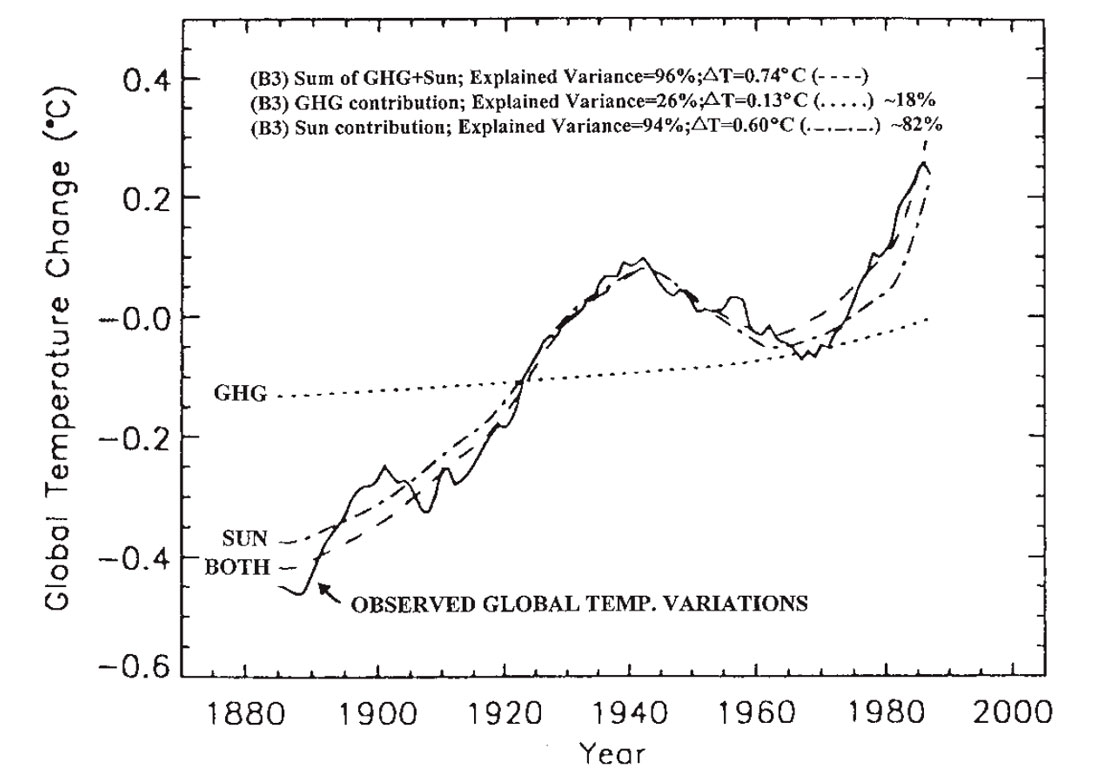
Figure 2: Optimized energy-conservation global climate model result from Soon etal (1996) with the best overall fit between observed (solid line) and predicted (dashed line) global land surface air temperature variations for the period from 1880-1993, their case B3. Note the extremely good fit between these two curves. This model result included a heating contribution from variations in solar input (Sun) and greenhouse gas concentrations (GHG). Various climate sensitivity “stretching’ factors were applied to the input profiles to obtain the best possible overall fit between predicted and observed temperature variations. The resulting contribution to the modeled temperature variation from each input are also shown, for GHG (dotted line) and for the Sun (dash-dot line). However, this particular model result, in which over 80% of the temperature variation could be attributed to the Sun alone, was discarded by the authors because it’s stretched solar profile did not conform to satellite observations of Total Solar Irradiance over the last couple of decades. There are reasons why this model result may yet turn out to be a viable solution. Their best model result that did fall within the satellite observational limits indicates that 71% of the temperature variation could be attributed to the Sun alone. Adapted from Soon etal (1996).
The Earth’s atmosphere has a filtering effect on the incoming solar irradiance and thus the net solar irradiance that reaches the surface of the Earth to contribute directly to surface heating may vary somewhat differently than TSI (above the atmosphere). The amount of the incoming light energy that is reflected back out into space, called the “albedo” of a planet, and the amount that is absorbed by the various layers of the earth’s atmosphere apparently vary as a function of the wavelength, or frequency, of the incoming light. Since the above models were optimized to surface temperature variations, their stretched solar profiles should be more representative of the net surface irradiance that contributes directly to surface heating, not necessarily the TSI profile. Therefore, upon further investigation, the model results mentioned earlier that were discarded may still turn out to be valid solutions and indicate that a very high percentage of recent global warming may be attributable to the Sun alone. Also, other heating factors such as other atmospheric dynamics, feedback systems, biothermal, geothermal, volcanic, the greenhouse effect and the waste heat that is produced by various aspects of human activity, not just by the burning of fossil fuels, are part of the surface heat budget and add to the complexity of the problem.
Some people claim that the rate of reported global warming this century is too high to be the result of natural non-human factors and that therefore that this is proof that human activity is primarily to blame. But the rate does not appear to be anomalously high at all when compared to the deglaciations at the end of the ice ages of the past, which in general appear to have taken place fairly rapidly, or when compared to the apparently rapid fall and rise in solar activity and northern hemisphere temperatures from about 1765- 1800 and 1810-1825, respectively, again see Figure 1. This cool period is a part of what has been referred to as the “little ice-age” from about 1400 to about 1800, when, for example, for a number of years the Thames River in London, England apparently froze over in mid-winter so that Londoners were able to skate on it, this appears to be the only time that this ever happened in the recorded history of the region.
The reported recent global warming also appears to be strictly a very near surface phenomenon within the Earth’s atmosphere, since global balloon and satellite microwave observations of the Earth’s troposphere, the lower 11 km. of the atmosphere, which exclude surface air temperature measurements, from 1979 to about 1995 appear to actually show a cooling trend even though the observed global surface air temperatures have been rising rapidly during the same time period, see the Petition Project website.
Since any global warming from whatever source will apparently result in the release of more CO2 from the oceans into the atmosphere thus raising the CO2 concentration of the atmosphere, as was apparently the case in the interglacial periods between the ice ages of the past, Hutcheon (1999) and Hengeveld (1999), then at least a portion of the observed rise in atmospheric CO2 concentrations may be a natural response to the solar warming. However, in my opinion it does appear that most of the observed rise in atmospheric CO2 concentrations over the last 100 years is the result of human activity. However, other variables such as the concentration of atmospheric water vapor and global cloud cover apparently play a much more significant role in global warming than CO2 concentrations. Svensmark and Friis-Christensen (1997), reported that global cloud cover varies in response to the solar cycle. And there is also the discovery early in 1998 by Swedish scientist Gunnar Myhre, Alberta Report (1998), which indicates that CO2 has 15% less global-warming power than previously indicated.
Research relating to this whole issue is expanding rapidly. For example, at the meeting of the American Geophysical Union in San Francisco in December 1998, there were many papers presented dealing with the sun-climate connection and with growing evidence of rapid climate change in the geologic past. This continued at the meeting of the International Union of Geodesy and Geophysics in Birmingham, Alabama in July, 1999.
If the Sun is the primary cause of recent global warming, which appears to be the case, then it would also appear that the contribution to the observed warming from the increasing concentrations of CO2 in the atmosphere due to human activity has been greatly over estimated. There has also been various work done to try to predict the future course of solar output. One such group of work indicates that longer-term solar output will probably continue to increase for a few more decades until passing through a peak around AD2030 and then it will gradually decline for about 100 years, White (1999). Others indicate that secular solar activity may have already peaked and that we should be entering a cooling period shortly. These normal and natural cycles in solar output may also help explain the comings and goings of the ice ages of the past. Very long-term predictions indicate that we are already slowly headed into the next ice age, which should be at its coldest some 23,000 years from now, Imbrie and Imbrie (1979). Therefore, a general reduction in CO2 emissions in the near future may not be a necessary or even an appropriate course of action at all as far as global warming is concerned.
Dr Theodor Landscheidt of the Schroeter Institute for Research in Cycles of Solar Activity, in Nova Scotia, has also come to the conclusion, that “global warming” is mostly due to solar variations, and he has predicted that we will be in another “little ice age” by about the year AD2030, see his website in the list of references. And Dr. Tim Patterson, Professor of Earth Science at Carleton University in Ottawa apparently also believes that “global warming” is mostly natural, Patterson and Harris (1999).
Obviously there are significantly negative effects of human activity on the environment and we do need to clean up our act to ensure the healthiest environment possible for all of us and future generations on this planet. However, hopefully we will have the wisdom to focus our finite resources on the environmental problems that we are indeed responsible for and thus can hopefully be the most effective at mitigating, global warming does not appear to be one of them. This wisdom will hopefully also leave more resources available for other problems that plague the human race.
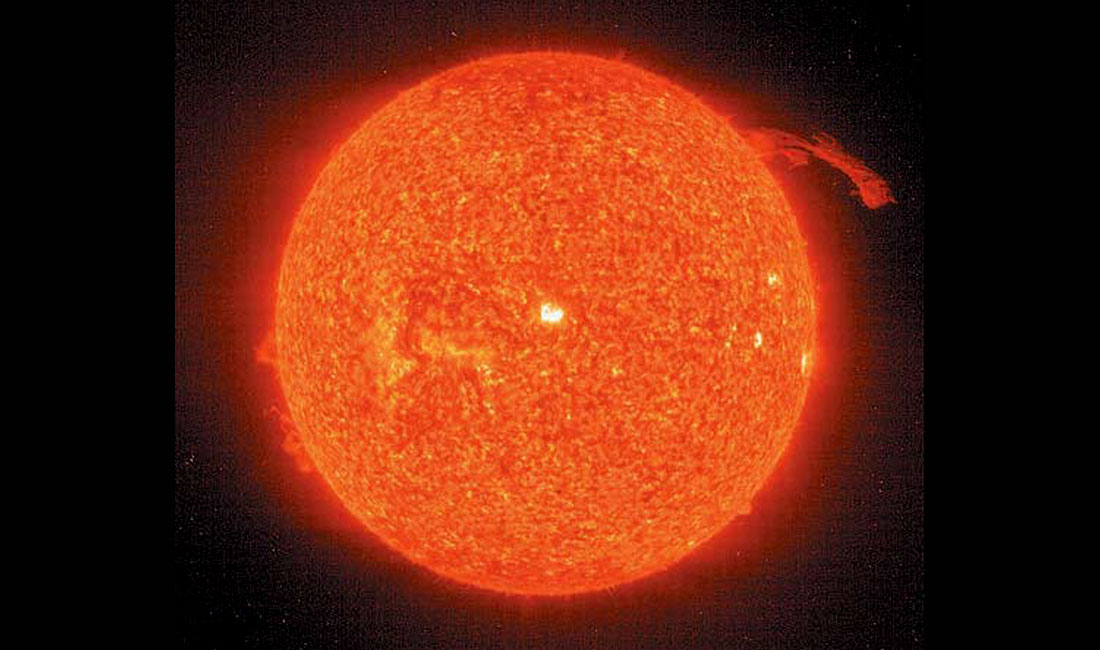
SOHO-EIT He II 304 Å (~ 60,000 K) 1996 June 6 22:35 UT
This EIT full sun image, taken on 6 June 1996 in the He II emission line at 304 A shows the upper chromosphere/lower transition region at a temperature of about 60,000 K. Note the large erupting prominence at the north-west limb (upper right). These eruptions occur when a significant amount of cool dense plasma or ionized gas escapes from the normally closed, confining, low-level magnetic fields of the Sun’s atmosphere to streak out into the interplanetary medium, or heliosphere.
Eruptions of this sort can produce major disruptions in the near Earth environment, affecting communications, navigation systems and even power grids. SOHO, with its uninterrupted view of the Sun, can observe such events continually, and allow us for the first time to get a better understanding of how such violent events occur.
Photo courtesy of SOHO Consortium.

Acknowledgements
The author would like to thank those friends and colleagues who provided moral and technical support of my research and the writing of this article. I would like to particularly thank Allan Feir, Technical Editor of the Recorder, for his help in reaching a final draft of this article.


Join the Conversation
Interested in starting, or contributing to a conversation about an article or issue of the RECORDER? Join our CSEG LinkedIn Group.
Share This Article