Summary
The two major challenges that 4D seismic analysis will face in the next decade is to make it work for carbonate reservoirs and to extract production related information from 4D data sets where the signal to noise ratio is low. In order to meet these challenges we have to test various methods. Some of these opportunities are discussed in this paper: The need for new and innovative rock physics measurements, especially to gain more insight into how varying stress conditions influence the seismic parameters. How to couple the reservoir fluid flow simulator with 4D data, and furthermore how the geomechanical modeling should be coupled to the time-lapse seismic data in an optimal way. Recent 4D studies from compacting reservoirs have revealed that we have to study the overburden rocks as well as the reservoir itself, and therefore there is a need to increase our insight into geomechanical changes. New methods for 4D analysis, such as for instance increased exploitation of the seismic long offset information are discussed. New directions might be to constrain the 4D analysis with other measurements such as electromagnetic sea bed logging or high precision gravimetric measurements. The focus on high repeatable data will probably continue, although the dramatic improvements in seismic repeatability we have seen in the last decade, is expected to be more moderate in the future. Shot generated noise and weather generated noise are some of the reasons for assuming that this will happen.
Introduction
Time lapse seismic is now well established as a reliable reservoir monitoring technique that certainly adds value to the reservoir management of a hydrocarbon field. It compliments other monitoring techniques, an especially attractive feature in this respect is the accurate spatial drainage maps that can be provided by 4D seismic. Although the uncertainties might be high and sometimes hard to control, the fact that seismic data can cover the whole field in an efficient way, is very attractive. In this paper I will discuss some future challenges that I see for 4D, and list some of the unexplored or not fully explored techniques that can be used to overcome some of these challenges.
There are several interesting techniques that I will not cover in this paper, for instance passive seismic monitoring methods, that have shown very promising results for several fields. Other well-known techniques such as various tracer technologies will not be discussed in this paper. Therefore, this is not an attempt to write a comprehensive overview of unexplored techniques for reservoir monitoring, but to focus on some techniques and possibilities that I think might be successful in the future.
4D in stiff rocks – is long offset 4D analysis an alternative route?
Most of the successful 4D case examples have been acquired at reservoirs containing high porous clastic rocks. Examples of such fields are Draugen and Gannet (Koster et al., 2000), Gullfaks (Landrø et al.,1999), Troll (Elde et al., 2000), Schiehallion (Parr et al., 2000), Foinhaven, Norne (Osdal et al., 2002), and Heidrun (Furre et al., 2003). Some of the major chalk fields, like for instance the Ekofisk (Guilbot and Smith, 2002) and Valhall (Barkved et al., 2003 and Barkved, 2004) fields in the Southern North Sea have also reported good 4D results. However, for stiffer and more low-porous rocks, the number of 4D success stories is limited. In last year’s SEG distinguished lecture series (Calvert, 2005) there is one example of 4D for a carbonate reservoir, among several other examples. There are several causes for this, but the major reason is that the changes in seismic parameters are smaller than the background 4D noise level. This background noise level is essentially controlled by two factors, the repeatability level of the seismic data, and the amplitude level of the background noise. The background noise might be caused by varying weather conditions (weather noise), drilling (or other activity) at the field, ship traffic, other seismic vessels in the area etc.
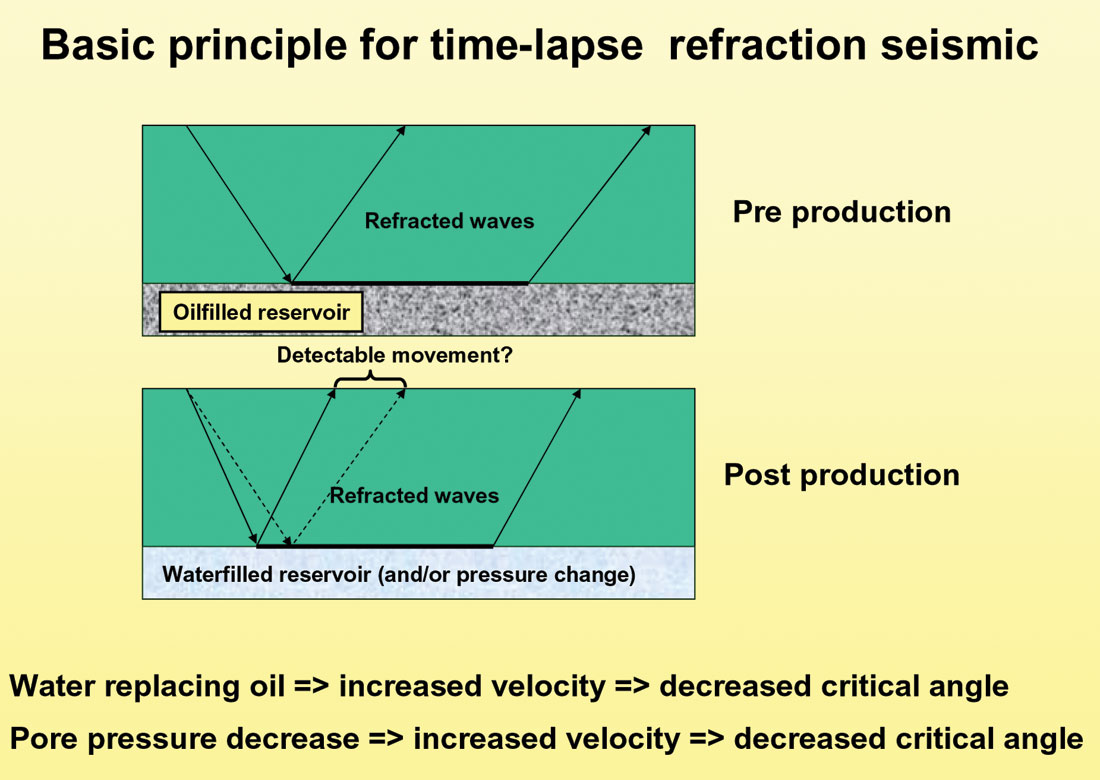
A relatively new idea trying to overcome this problem is to measure the shift in critical offset caused by P-wave velocity changes within the reservoir layer (Landrø et al., 2004). The basic idea for this method is shown in Figures 1 and 2. Time lapse refraction seismic has potential for accurate estimation of reservoir velocity changes. Careful processing using rugby-shaped fk-filters, followed by RMS amplitude analysis versus offset is used. Typically, the RMS amplitude level peaks at an offset value slightly larger than the critical offset. By measuring the shift in this peak between the base line and monitor survey, it is possible to estimate the velocity change in the reservoir layer. If we consider a reservoir layer under-laying a cap-rock, the critical angle (θc) is given by

where v1 and v2 represent the P-wave velocity above and below the top reservoir interface. If the P-wave velocity within the reservoir layer changes during production, the critical angle will also change correspondingly:

The incidence angle can be approximated as

where z and vRMS are the thickness and the root mean square velocity of the overburden. Furthermore, x is the offset between the source and the receiver. The only approximation used in the derivation of Eq. 3 is that the overburden is treated as an homogeneous medium with an effective velocity. Assuming that the RMS-velocity and the thickness of the overburden remain constant during production, we obtain from equation (3)

and correspondingly that the new critical distance is given as

Subtracting equations (4) and (5) and expanding to the first order yields:

Assuming a reservoir at z=2000 meters depth with velocity v2=2500 m/s and root means square velocity of the overburden Vrms=1800m/s, equation (6) gives a change in the critical offset

Thus, a change in velocity of the reservoir of 1% i.e. 25m/s gives an 85m change in critical offset. This clearly shows the potential of the method. However, there are several concerns associated with this method:
- refracted events from overburden (especially seabed)
- geometrical shape of the reservoir, interference with other refracted events etc.
- high velocity overburden layers might act as blockers (depending on thickness)
The first concern in the list above, can be attacked by conventional fk-filtering. Shallow refractions will often have a different slope than deeper refractions, and therefore a simple fk-filter will attenuate the interference between the critical reflected events from the top reservoir layer and other interfaces above the reservoir. More advanced methods would be model based where the refracted energy generated at the sea floor is modelled, adjusted, and then subtracted from the original data set. The geometrical shape of the reservoir might be a challenge, especially when time lapse refraction maps are made. From synthetic modelling examples we have found that high velocity overburden layers thicker than 20-30 m will probably be a blocker to the method, although some energy will penetrate through such a layer. Despite these concerns, the simplicity of the method and the fact that seismic signals are strong close to critical angles, indicate that this method will be tested for some fields in not too far future.
Figure 3 shows synthetic 2D finite difference data (base and difference) based on well log information from a North Sea reservoir. RMS curves versus offset for the same synthetic example (Figure 4) shows a clear shift in critical offset for 2 and 4% change in reservoir velocity
4D rock physics measurements
Within the accuracy of present 4D projects, my impression is that the accuracy of Gassmann fluid-substitution is sufficient in most cases. The uncertainty associated with quantitative estimates of fluid saturation changes from seismic data is significant, often of the order of 30-40%. For calibration purposes, also the well measurements of saturation have high uncertainties.
M o re research and rock physics measurements are needed to study how changes in the stress field impacts the seismic parameters. Several researchers have measured for instance the Vp to Vs ratio for changes in effective pressure. Huffmann and Castagna (2001) and Zimmer et al. (2002) are some examples. All rock physics observations made on unconsolidated sands show that the Vp to Vs ratio increases for low effective pressure. Landrø and Duffaut (2004) made an attempt to compare such measurements with time-lapse seismic data from two North Sea fields, and found that the Vp to Vs ratio increased in both field examples as the pore pressure increased. However, in most cases the horizontal stress is often less than the vertical stress. Especially when the effective stress is approaching zero, this anisotropic stress field might be a crucial effect, and therefore measurements for various anisotropic stress field changes, and for various clay contents would be useful for future 4D interpretation work.
Recently, the use of numerical rock models has been proposed as a low-cost alternative to laboratory measurements on real rock samples taken from the field. The success of the Gassmann model clearly shows that this might be an alternative and cheaper way to link rock physics to 4D seismic interpretation. However, I think that the complexity and variability of the subsurface rocks and how they respond to various production effects is large, and therefore we have to do proper rock physics measurements also in the future. The question is to what degree the numerical rock concept can replace routine rock physics measurements. Draege et al. (2004) underlines the importance of treating various clay minerals in a proper for rock physics modeling of clay cementation.
The coupling between 4D seismic and reservoir simulation
The idea of coupling the reservoir simulator to 4D seismic interpretation in various ways have been discussed for many years, but the practical breakthrough in this effort is still lacking as far as I know. Several papers outline various ways of combining the two disciplines, and several commercial projects between various contractors and oil companies have been launched. The EU sponsored HUT’s project (Gosselin et al., 2003) suggested to use impedance cubes (estimated from seismic inversion) as the common dataset to work on. Vaso et al., 2004, presents an inversion method using time-lapse amplitude changes as input.
Typical reservoir parameters estimated by their approach are permeabilities. In a recent paper, Foldstad et al., (2005), shows an innovative way of coupling the reservoir simulator in order to estimate and predict 4D noise.
Upscaling and downscaling issues are critical issues to achieve a good coupling between 4D and the simulator, and new methods to find the right scale for model representation and effective estimation of key reservoir parameters will be important future research topics. For a 3D reservoir model, the general inverse problem of determining relative permeabilities (and porosities,…) directly from time-lapse seismic data is ill-posed. Compared to traditional history matching techniques, it is obvious that time lapse seismic data will offer an alternative source of information that might constrain the history matching process in a fruitful way. However, the future goal must be a common earth model, probably with a regular, rectangular grid, where well data, seismic data and reservoir simulated data can co-exist. However, there are probably some intermediate steps that will be very useful, and reveal new insight into how the various disciplines should be coupled in an efficient way.
Uncertainty assessment (Landrø, 2002) and a comprehensive understanding of how the total uncertainty coupled to the reservoir model is composed of the various information sources are key topics. Presently, we are not paying enough attention to an overall uncertainty understanding.
The coupling between 4D seismic and geomechanics
Several hydrocarbon fields compact during production, and this compaction process often leads to changes in the overburden. By using time lapse seismic data, we can estimate traveltime changes caused by such effects. Guilbot and Smith (2002) give a field example from the Ekofisk Field in the North Sea, where reservoir compaction of the order of 7-8 meters has been observed. Since the seabed subsidence often is less than the reservoir compaction (measured in the well), it is reasonable to assume that the overburden rocks are stretched. Using post-stack time lapse timeshifts one is faced with an ambiguity here: From the estimated timeshifts we want to determine the velocity change and the thickness change simultaneously. Guilbot and Smith used an empirical velocity-porosity relation to resolve this ambiguity. For a chalk reservoir (like Ekofisk and Valhall) such velocity-porosity relations are quite unique, with low scatter in the crossplots. However, for the overburden rocks, such relations are much more scattered, and lack of empirical data for different depths is a problem. Therefore alternative methods have been proposed (Landrø and Stammeijer, 2004) exploiting near and far offset derived timeshifts or using pre-stack time lapse data to resolve this ambiguity (Røste et al., 2005). Hatchell et al., 2005 use a method combining the time lapse seismic analysis with geomechanical modeling for the reservoir and the overburden rocks. This is a nice way to constrain the estimation procedure and thereby reduce the uncertainties in the estimated thickness and velocity changes. Both Hatchell et al. and Røste et al. introduce the dilation factor as a critical parameter:

Here v represent the P-wave velocity within a given layer, and z the layer thickness, while dv and dz represent the changes in velocity and thickness. From time lapse studies at the Valhall Field, it is found that this parameter is negative, and larger in absolute value for the overburden than for the reservoir. Whether this is caused by the difference between stretching (overburden) and compacting (reservoir) a rock is still a topic for further research. Different ways of coupling geomechanical modeling and seismic modeling are presently in progress, and I think we will see interesting improvements in these fields in the years to come.
The best 4D laboratory: The reservoir
There are several examples demonstrating the effect of pore pressure increase on time lapse seismic data. Some field examples are Gullfaks (Landrø, 2001, Landrø et al 2001), Statfjord (Rognø et al., 1999, Landrø and Duffaut, 2004). Other examples can be found in Rodney Calvert’s distinguished lecture book (Calvert, 2005). However, there are few examples showing that seismic data is sensitive to a pore pressure decrease. In an early time lapse experiment from the Magnus Field, the main 4D signal was attributed to huge pressure depletion (Watts et al., 1996). Tøndel and Eiken (2005) observed possible 4D changes measured at the Troll Field that could be attributed to a pressure decrease of approximately 1.5 MPa.
In order to test if a pore pressure decrease can be observed by time lapse seismic under controlled reservoir conditions, a dedicated test was performed at the Gullfaks Field some years ago (Landrø et al., 2005). Due to maintenance work at the field, two water injection wells were available for a dedicated pressure depletion experiment: A controlled time lapse VSP experiment was acquired with a time interval of 4 days at the Gullfaks Field in the North Sea. The pore pressure was decreased by 2.5 MPa in a controlled way by shutting in a water injector. An average amplitude decrease of approximately 6-7 % was observed at a 12-level VSP tool in a neighboring well. Time shift analysis measured a decrease in traveltime of about 0.7 ms for an interface near the base of the reservoir. We estimate that this corresponds to an average velocity increase of approximately 1.6%, again corresponding to an amplitude decrease at top reservoir interface of approximately 8% for zero offset incidence angle. Comparison with ultrasonic core measurements shows that the estimated amplitude changes are smaller than expected from the lab measurements, however still within the uncertainties of the time lapse seismic VSP experiment. Figure 5 shows the base monitor and difference stacked seismic response from this VSP experiment. We notice that the amplitude decrease at the top reservoir (5%) is smaller than the background RMS-error (14%). Despite the fact that our observations are of the same order as the background noise level, it is interesting to observe that the amplitude changes are small, and probably less than what we expect from ultrasonic dry core measurements.
Repeatability improvements – weather and source stability
Repeatability has been and will probably be a key issue in 4D seismic. However, there is a practical lower limit for repeatability, and in my opinion we are now close to the limit where variations in weather and the source will be the limiting factors. For most 4D studies, these limits will be hard to overcome, and we are therefore forced to change the focus slightly in 4D: we need to develop methods that are robust to these remaining noise types, and focus on how to extract information from 4D data where the signal is weak and the non-repeatability needs to be coped with.
For permanent solutions however, weather noise and background noise from operations at the field might be handled in other ways, since such 4D projects are more flexible to when the recording has to be done. By choosing the right time window for acquisition one can therefore avoid much of the typical 4D noise, such as weather and rig noise. A concern that will arise again if we reach this future repeatability levels (we are probably talking about 1% or less in normalized RMS error between two surveys), is shot generated noise. Figure 6 shows that the RMS-level decreases rapidly as a function of recording time. After 10 seconds we observe that the amplitude level is still around 3 microbars, and the example shown in the box to right in this figure, clearly shows that we might want to measure 4D signals with this magnitude. In practice, this might mean that we have to increase the shot interval in order to cope with this shot generated noise even for 4D studies where the recording equipment is permanently installed.
The stability of the source signature will also be a critical issue under such conditions. As shown in Figure 7, even small variations in bubble time period might cause RMS-errors that might be critical. However, to monitor and measure the source performance is doable with technology available today. Variations in weather conditions will be harder to cope with, even for e-field solutions.
Since the beginning of large-scale 4D reservoir monitoring in the 1990ies, there has been a significant repeatability improvement, as sketched in Figure 8. Due to reasons discussed above, it is expected that this improvement will now flatten out. Therefore, alternative methods for improving the repeatability level should be investigated. Presently the most promising method in this category is the virtual source method proposed by Bakulin and Calvert (2004). For areas where the overburden complexity is the main cause for low repeatability, they have shown that a few measurements of the wavefield below the overburden zone will significantly improve the repeatability level of 4D seismic data.
The use of 4C data in 4D
There are few examples of 4C (four component) data being used in 4D. Some examples are the Alba Field (MacLeod et al., 1999), the Statfjord Field and the Valhall LOFS(Life Of Field Seismic) projects. There are several opportunities attached to the extra information content that can be provided in a 4D study by using 4C data (Stovas and Landrø, 2004, Landrø et al.2003). Especially for discriminating between various production related effects, for instance pressure and saturation, the extra shear information might help. Furthermore, 4C data sets will have an azimuth distribution that is more extensive than a conventional streamer survey. Especially for detecting changes in anisotropy, this might be valuable for reservoirs where the stress changes induce systematic cracking patterns within the reservoir. Another attractive feature for 4C data is the presence of long offset data, which enable us to use the previously described 4D refraction method. Furthermore, it can be shown that the PS reflection coefficient peaks for an incidence angle corresponding to the critical P-wave angle, as shown in Figure 9. By measuring the shift in this PS-peak, it is suggested to estimate changes in P-wave velocity. This peak will not be shifted if a change in S-wave velocity is applied, so in this respect this method is a clean P-wave change estimator.
Repeated gravimetric measurements
The idea of actually measuring the mass change in a reservoir caused by hydrocarbon production, has been a round for quite some time. The limiting factor for gravimetric reservoir monitoring has been the repeatability (or accuracy) of the gravimeters. However, two years ago, Sasagawa et al. (2003) published a paper where they demonstrated that improved accuracy can be achieved by using 3 coupled gravimeters placed at the sea floor. This technical success led to a full field program at the Troll Field, North Sea, see Figure 10. Another successful field example is a time-lapse gravity monitoring of an aquifer storage recovery project in Leyden, Colorado (Davis et al., 2005), essentially mapping water influx.
Obviously, this technique is best suited for reservoirs where significant mass changes are likely to occur, such as water replacing gas. Shallow reservoirs are better suited than deep. The size of the reservoir is a crucial parameter, a given size is required in order to obtain observable effects. For monitoring volcanic activity, gravimetric measurements might help to distinguish between fluid movements and tectonic activity within an active volcano.
Time lapse EM surveys
Since the breakthrough of active EM (ElectroMagnetic) surveys some years ago (Ellingsrud et al, 2002) this technique has mainly been used as an exploration tool, in order to discriminate between hydrocarbon-filled rocks and water-filled rocks. Field tests have shown that such data are indeed repeatable, so there should definitely be a potential for using repeated EM surveys to monitor a producing reservoir. So far, frequencies as low as 0.25 Hz are being used (and even lower), and then the spatial resolution will be limited. However, as a complementary tool to conventional 4D seismic, 4D EM might be very useful. In many 4D projects it is hard to quantify the amount of saturation changes taking place within the reservoir, and time-lapse EM studies might be used to constrain such quantitative estimates of the saturation changes. Another feature of the EM technique is that it is not very sensitive to pressure changes, so it may be a nice tool for separating between saturation and pressure changes. This is in contrast to conventional 4D seismic, since seismic data is sensitive to both pressure and saturation changes.
In a recent paper, Johansen et al. (2005) show that the EM-response over the Troll West Gas province is significantly above the background noise level, see for instance Figure 4 in their paper. If we use the deviation from a smooth response (Figure 4b in their 2005-paper) as a measure of the repeatability level, a number of approximately 0.1-0.2 (measured in normalized EM-amplitude units) is observed. Compared to the maximum signal observed at the crest of the field (2.75) this corresponds to a repeatability level of 4-7%, which is very good compared to conventional time lapse seismic. This means that it is realistic to assume that time lapse EM-data can provide very accurate low-resolution (in x-y-plane) constraints on the saturation changes observed on 4D seismic data. Recently, Mittet et al. (2005) showed that depth migration of low frequency EM-data may be used to enhance the vertical resolution. In a field data example, the vertical resolution achieved by this type of migration is maybe of the order of a few hundred meters. The EM sensitivity is determined by the reservoir thickness times the resistivity, underlining the fact that both reservoir thickness and reservoir resistivity are crucial success parameters for 4D EM. This means that the resolution issue coupled to the active EM-method is steadily improving, and such improvements will of course increase the value of repeated EM-data as a complement to conventional 4D seismic.
Discussion and conclusions
Despite the successes of 4D seismic demonstrated by a number of field examples, there are several remaining challenges to be met. The focus on 4D repeatability has lead to a significant improvement, and I think we have to expect that this trend will flatten out in the years to come. For such a scenario, the shifted focus will probably be to develop methods that enable us to extract interpretable information about reservoir changes even when the 4D signal is weak or comparable to the background noise level.
The coupling between the reservoir fluid flow simulator and 4D seismic data, is still not efficient and ready to be used for 4D studies. There are some promising attempts to unify the two disciplines in a common tool, but there is still some hurdles to be passed.
Future improvements within 4D studies will probably come by constraining the time-lapse seismic information by other types of information, such as geomechanical modeling, time-lapse EM or gravimetric data or innovative rock physics measurements.
Our understanding of the relation between changes in the subsurface stress field and the seismic parameters is still limited, and research within this specific area will be crucial to advance the 4D in future. New analysis methods like long offset 4D, might be a complementary technique, or alternative method where conventional 4D analysis has limited success. However, this technique is limited to reservoirs where the velocity increases from the cap rock to the reservoir rock.

Acknowledgements
Lasse Amundsen, Rodney Calvert, Per Digranes, Kenneth Duffaut, Ola Eiken, Erling Fjær, Jan Petter Fjellanger, Anne Kari Furre, Paul Hatchell, Ståle Johansen, Rune Martin Holt, Hossein Mehdizadeh, Rune Mittet, Kiet Nguyen, Thomas Røste and Lars Kristian Strønen are all acknowledged for support and discussions. I want to thank the Norwegian Research Council (NFR) for financial support to the ROSE-project at NTNU.


Join the Conversation
Interested in starting, or contributing to a conversation about an article or issue of the RECORDER? Join our CSEG LinkedIn Group.
Share This Article