Introduction
Resource assessments have generally attempted to estimate the total resource in an area or formation. This approach can provide very large numbers that are misleading for both industry experts and the general public. This paper proposes a new, simple method to assess resources that recognizes that not all resources are physically accessible or economically available for production. The focus of this paper is on Canada’s natural gas resources, however the same approach can be applied to any natural resource.
Preliminary results using the Canadian Gas Potential Committee’s summary data based on 1998 reserves are presented to illustrate the method. Detailed scrutiny by other Industry specialists will improve the quality and credibility of these results.
This review suggests only about 123Tcf of future gas production is accessible and available under current technological and price expectations. This is far below the expectations of the NEB and EIA for Canada’s gas production over the next twenty-five years. Either we have to increase our R&D and exploration efforts to find and produce less accessible gas or we can expect considerably lower supply and higher prices in the future.
While I have sought advice and input from a variety of groups and individuals, the results presented in this paper are strictly the views of the author. I am grateful to the Canadian Gas Potential Committee for permission to use data from their 2001 report to develop this assessment.
Background
A number of groups have attempted to quantify Canada’s natural gas resources. The most recent by the Canadian Gas Potential Committee (CGPC, 2001) estimated Canada had 592Tcf of conventional gas resources; 246Tcf of this gas remained to be discovered as of the end of 1998. In addition vast volumes of gas are trapped in coal beds and in gas hydrates.
These numbers appear to provide considerable confidence for future supplies, however all studies to date have avoided the issue of whether the gas is physically accessible or economically available to produce.
This results in some very large numbers that may be misleading when future reserve and production projections are made. This paper is an attempt to provide some clarity to the published numbers.
The CGPC–2001 Report explicitly states it has not assessed whether undiscovered resources are accessible or economic to pursue. However it is amazing how often this is overlooked when organizations and individuals use the data to predict future gas supplies. This is common within the industry and is even more problematic when the data is used for economic planning outside our industry.
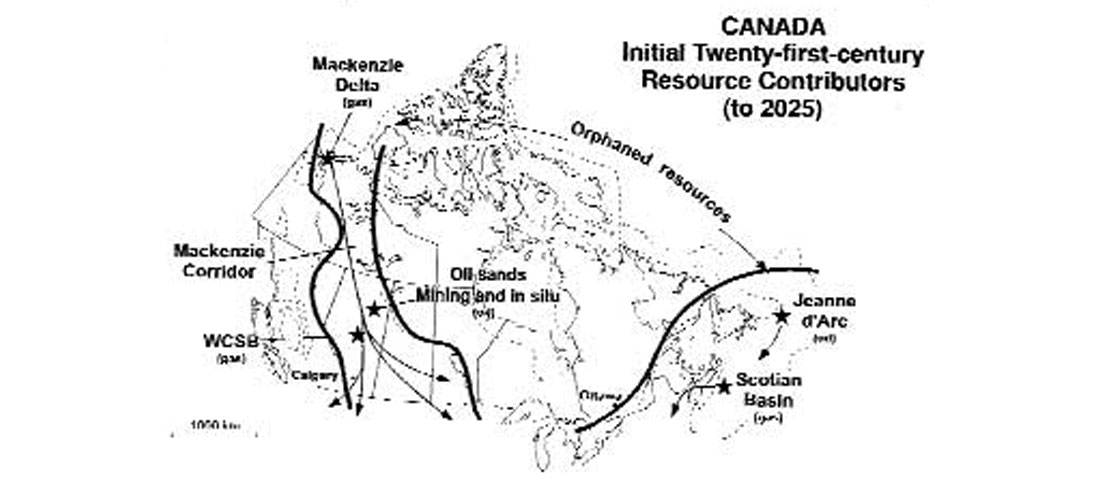
Skipper (2001) raised the issue of the rate of conversion of resources to producible reserves and identified some of the challenges facing production of Canada’s remote or ‘orphaned’ resources (Figure 1). While the problem was recognised no attempt was made to quantify these remote resources.
Clearly it is impossible to accurately quantify the unknown; however, a detailed look at all the data provides an indication of how realistic the current numbers may be for predicting future supply. Three issues need to be considered:
1. Conventional and Unconventional Gas
Canada’s total gas resources are huge (Russum, 2003); known resources are trapped in sedimentary basins primarily in Western Canada (WCSB), and adjacent to the three coastlines of Canada. These gas resources are found in both ‘conventional’ and ‘unconventional’ reservoirs.
Conventional Gas – virtually all of the gas produced in Canada to date is considered conventional gas – buoyancy driven deposits occurring as discrete accumulations in structural or stratigraphic traps (Law, 2002). The challenge for this gas is primarily discovering the reservoir; production is relatively easy.
Unconventional Gas – (called Non-conventional gas by the CGPC) – has only become of interest in Canada as prices rise and conventional gas reserves dwindle. Law (2002) described these resources as “not buoyancy-driven accumulations that are regionally pervasive and commonly independent of structural or stratigraphic traps”. Four types of natural gas resources are currently recognised as unconventional: Coalbed methane (CBM), shale gas, tight gas and gas hydrates. These resources may be relatively easy to find however production of the gas is both challenging and more expensive than conventional gas.
2. Not all gas can be sold
The total volume of gas is the resource. Known resources that can be physically and economically produced are considered to be the current reserves.
The reserves in a reservoir are typically quantified as Gas In Place (GIP). Depending on the physical properties of the gas and reservoir; only a portion of this gas will be produced. The produced gas may include carbon dioxide, hydrogen sulphide and other non-hydrocarbons; these must be extracted prior to marketing the natural gas. In addition, some gas is used to fuel the plants and operate the pipelines. Historically, about 60% of the proven GIP is actually available for sale.
The CGPC coined the term “Nominal Marketable Gas” to convert estimates of undiscovered GIP to marketable gas. It is vital any comparative studies clearly differentiate between “Resources”, “Reserves” and “Marketable Gas”. The smallest number will of course be the marketable gas, for consistency this has been used in this assessment. The sum of all the known marketable gas represents the known future supply.
3. Physically Accessible and Economically Available
For the purposes of this study, the terms ‘physically accessible’ and ‘economically available’ are introduced to attempt to better understand the resource base:
Physically accessible – describes resources that could be produced i.e. they are in areas where oil and gas exploration can be legally pursued. This removes resources that are within national parks, under urban areas and other areas where exploration and production are impossible or illegal.
Economically available – identifies resources that we can reasonably expect to produce with our current knowledge of technology and product prices.
The National Energy Board’s latest consultation (NEB, 2003) implies that access is not a problem (“Removing restrictions on land access in the WCSB has a marginal impact on overall supply…..”). Conversely, Bob Meneley (Personal communication) suggests that 10 – 25 % of the undiscovered gas in Western Canada might be inaccessible. CGPC-2001 indicates, “…in some of the plays in the Foothills Play Group, as much as 40% of the play area may be closed to exploration.”
This study attempts to look at all Canada’s conventional and unconventional marketable gas from the standpoint of physical access and economic availability. The statistical analysis using known pool distribution to predict undiscovered pools may already reflect some adjustment for access and availability, this should become more apparent in future assessments.
It is important to recognize that estimates of Canada’s marketable gas will change as our knowledge and technology improves, the intent of this paper is to provide a simple approach that can be adapted to assess existing and future resource estimates.
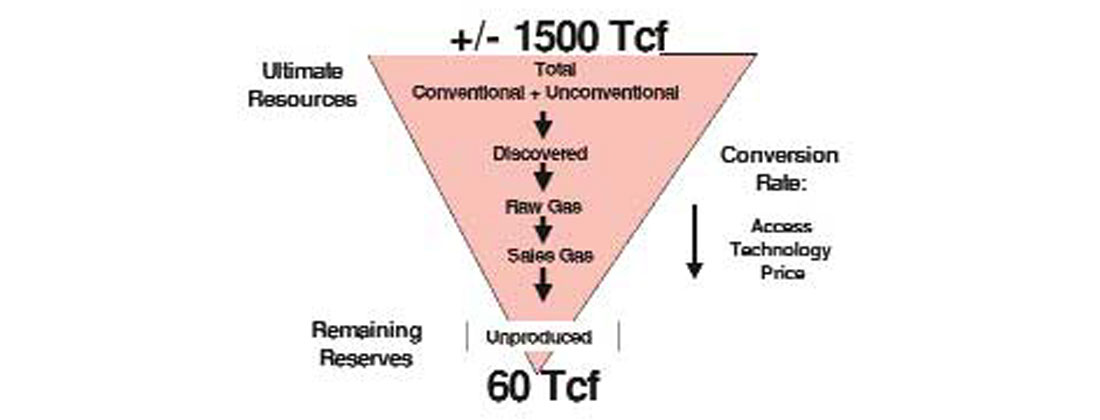
Canada’s current, known, accessible natural gas reserves are approximately 60Tcf; with production at over 6Tcf per year, this is less than a ten-year supply. The challenge for the future is how quickly and economically Canada’s gas resources can be converted to producible reserves. (Figure 2).
Resource Accessibility
To the outsider, it may appear Canada’s petroleum industry has virtually unlimited surface access to explore and produce oil and gas. In reality, virtually all land has some form of surface access restrictions. These range from issues that can be resolved through negotiation, additional cost or focusing activities during certain times of the year, others that are impenetrable making resources underlying these lands impossible to find and produce.
Our current understanding of the occurrence of hydrocarbons indicates they are restricted to the sedimentary basins, I have divided these areas of Canada’s into three categories: Accessible, Accessible with significant restrictions and Inaccessible for the purpose of exploring and producing natural gas.
Accessible (Green) – Resource is readily accessible or limitations to access are not sufficient to prevent production. Most of the proven and unproven conventional resources in the Western Canada Sedimentary Basin fall into this category. Part year restrictions such as winter drilling or part year environmental restrictions would not limit inclusion in this category.
Accessible with restrictions (Amber) – Access restrictions are severe enough to seriously delay production. Examples include:
- sour gas in some rural and populated areas,
- gas overlying some heavy oil deposits,
- some lands claimed by First Nations
- Frontier areas like the MacKenzie Delta where the resource cannot be produced until a pipeline is approved and built.
Inaccessible (Red) – Surface access for oil and gas production is virtually impossible, the Mineral Rights are not available or the technology or infrastructure will not be available for the foreseeable future. Areas falling into this category include:
- the West Coast – where a Moratorium prevents exploration,
- gas production from the Arctic Islands,
- gas reserves within National Parks and beneath urban areas,
- gas from gas hydrates.
The G-A-R Approach
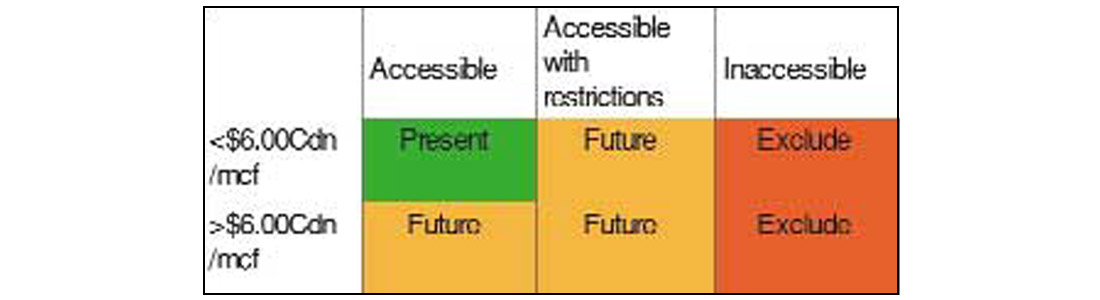
I have assigned colours – Green-Amber-Red (G-A-R) to the three categories to provide a very simple and easy to understand differentiation between resources falling into each category (Figure 3, upper row). Note that resources are not permanently assigned to a category eg:
- If the Moratorium on the West Coast were lifted, those resources could potentially move from Red to Amber.
- Once construction begins on the MacKenzie Valley pipeline it will be reasonable to move MacKenzie Delta gas from Amber to Green.
- Environmental restrictions, restrictions on gas production overlying heavy oil reservoirs and the increasing resistance to oil and gas activity (NIMBY) will move some gas from Green to Amber or even Red.
Economic Availability
The ability to find and produce marginal or remote resources is heavily dependent on price expectations and technological advances. Higher prices give greater incentive to develop new exploration and production techniques which could make currently uneconomic resources attractive to pursue. If and when these advances might occur and how significant an impact they will have is virtually impossible to predict. It is reasonable to assume there will be advances in the future however it is unwise to place any of these resources in the green category.
I have chosen an arbitrary Cdn$6/mcf* to differentiate resources we might pursue today compared to those we are unlikely to pursue until well into the future. Gas requiring a considerably higher price, must by definition fall into either the amber or red category. (*Cdn$6/mcf was originally chosen in 2002 as a price that far exceeded price expectations. Subsequent prices during the winter of 2002-2003 suggest this might not be such an extreme price. Higher prices may make more gas available in Canada however it will also reduce demand and make alternate natural gas resources such as the import of Liquefied Natural Gas (LNG) more attractive.)
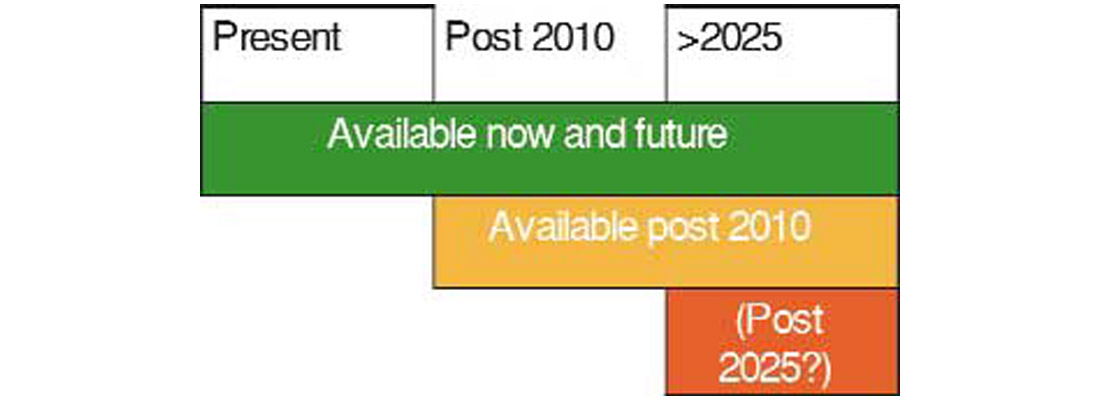
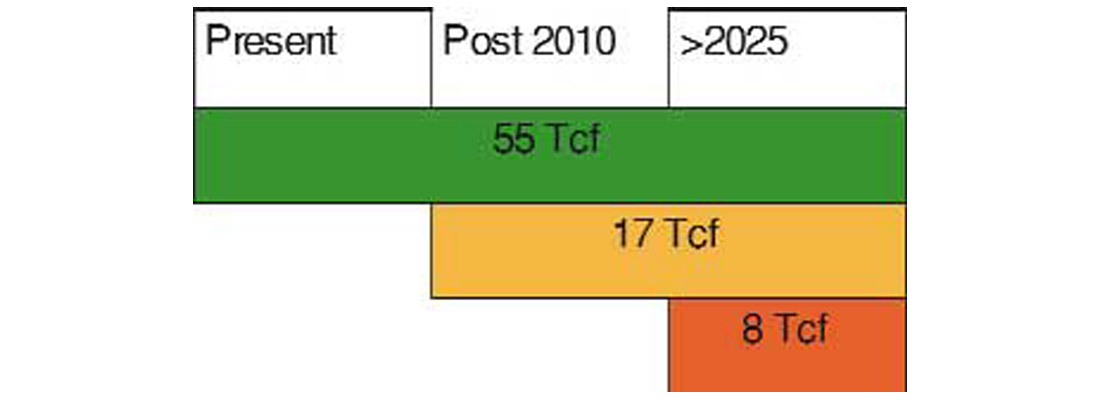
The three classes of accessibility along with the split in economic availability provide a six-box matrix (Figure 3). My approach to evaluating resources is not sophisticated enough to confidently divide the undiscovered resources into the six categories therefore the matrix is simplified back to the G-A-R characterization. To avoid the tendency to look at G-A-R resources as short, medium and long-term, I would suggest that green resources are available for production anytime in the future, amber sometime beyond 2010 and red resources if they ever become accessible, would not be produced before 2025. (Figure 4)
Having defined a flexible system for characterizing resources we should now be in a position to quantify any assessment of resources into the G-A-R categories. Obviously the results will vary depending on the initial data and the views of the analyst. The CGPC 2001 study is the most complete and up-to-date assessment of Canada’s gas resources so their data has been used to test the concept.
Applying G-A-R to Canada’s natural gas resources:
1. Conventional gas in the Western Canada
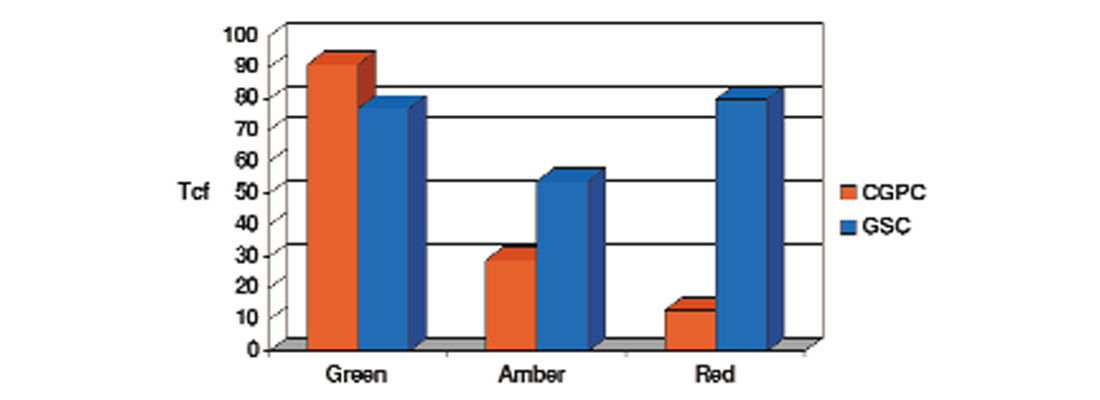
The CGPC (2001) estimated 80Tcf of undiscovered nominal marketable gas in 84 proven plays in Western Canada. My review suggests 55Tcf fall into the ‘green’ category (Figure 5).
The CGPC has been faulted for being too conservative in their assessment so it is interesting to apply the same G-A-R criteria to the more optimistic GSC data (from figure 2.6 of CGPC 2001). My analysis shows that differences are primarily due to the GSC including a large number of conceptual plays (“an exploration play that does not have discoveries or reserves, but which geological analysis indicates may exist”). This causes considerable differences in the amber and red categories but not the green. Therefore, while the additional gas identified by the GSC may exist it is unlikely to have an impact on supply in the short or medium term (Figure 6).
2. Conventional gas outside Western Canada
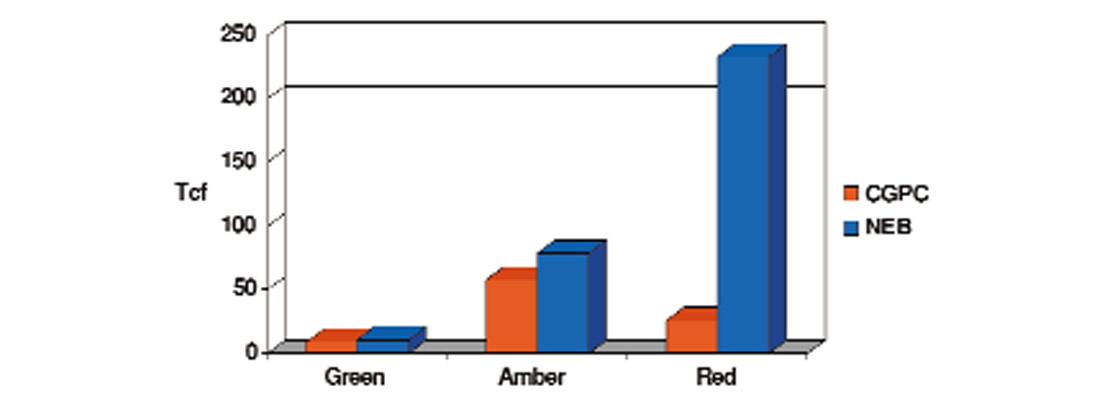
The same techniques have been applied to Canada’s conventional gas outside the WCSB. The CGPC chose to exclude conceptual gas plays from the estimated reserves while the NEB assumed that most of the conceptual plays would be successful. The CGPC identified 93 Tcf of “Ultimate Marketable Resources” which I have attributed to G-A-R as shown in Figure 7. The NEB (1999) assessed 323Tcf to the same resources however when the two databases are compared (Figure 8), the difference in interpretation is clearly in the amber and red category.

3. Unconventional gas resources
The Unconventional resource category traditionally includes coalbed methane (CBM), tight gas, shale gas and gas hydrates. Some of these resources, particularly tight gas, are part of the continuum of resource quality from conventional resources and are not differentiated in the statistics.
The database for the CGPC (2001) assessment was based on year-end 1998 reserves, at that time there was no economic CBM production in Canada. Resource estimates were provided however, no reserve estimates were developed.
A mid-point estimate of CBM resources for all of Canada gives a GIP of 378Tcf (CGPC, 2001). The best-known CBM resource occur in the Alberta Plains where it is estimated 29% occurs in concentrations greater than 3bcf/section; these might be regarded as the ‘sweet spots’ that might be attractive for development (Dave Hughes, Personal Communication).
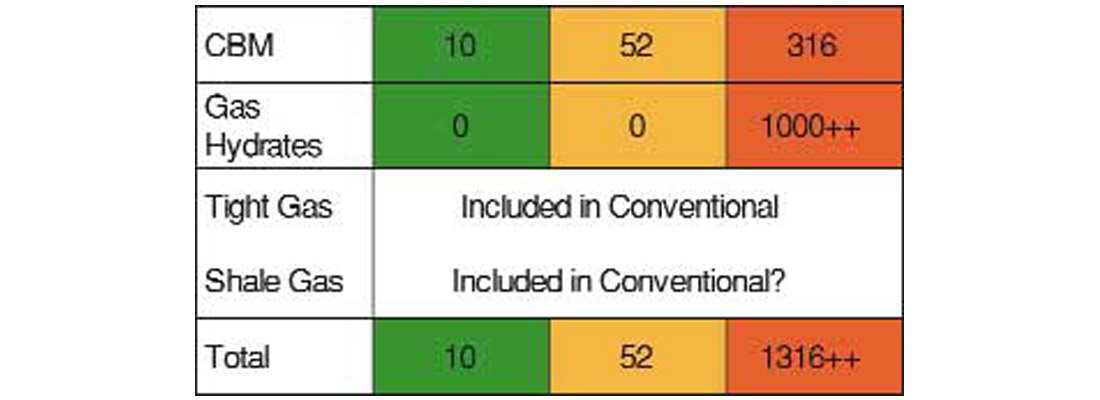
In 2002 we saw some cautious optimism as companies announced expansion of pilot projects and can expect to see CBM make a minor contribution to reserves and production in 2003. I have arbitrarily assigned 10 Tcf of CBM resources and 5 Tcf of marketable reserves in the green category (Figure 9). The credibility of these numbers will become much clearer in the coming months.
Gas hydrate resources appear to dwarf all other known resources of natural gas in Canada (>30 times more gas than in conventional resources according to Majorowicz, 2001). However, the technology is not yet available to produce this resource and the distribution in the permafrost of the Arctic and offshore, guarantee that these will be environmentally challenging and expensive to produce. Estimates vary as to when and how much of this gas might be produced but it may be at least 25 years before we see any production. All this gas has currently been assigned to the red category.
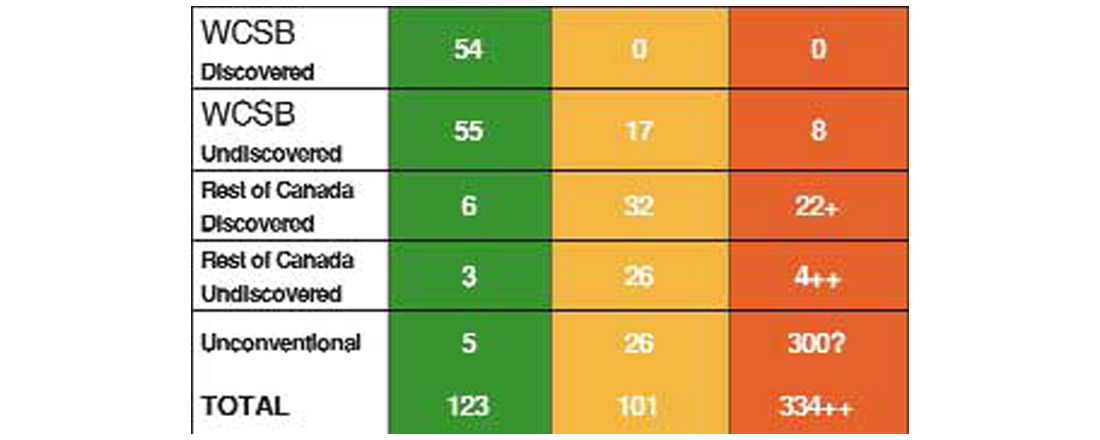
Putting it all together
Figure 10 provides a simplistic view of Canada’s marketable gas reserves based on 1998 data. These numbers will undoubtedly be revised with new information and more stringent and critical application of the G-A-R approach.
The numbers are very different from the assumptions of supply from Canada currently projected by both Canadian and US agencies. This approach suggests we have considerable work to do in research and exploration to meet future demands for natural gas in Canada and exports to the United States.
Application of this methodology to other natural resources such as coal, tar sands or even water will provide much greater clarity to future supply predictions.


Join the Conversation
Interested in starting, or contributing to a conversation about an article or issue of the RECORDER? Join our CSEG LinkedIn Group.
Share This Article