Summary
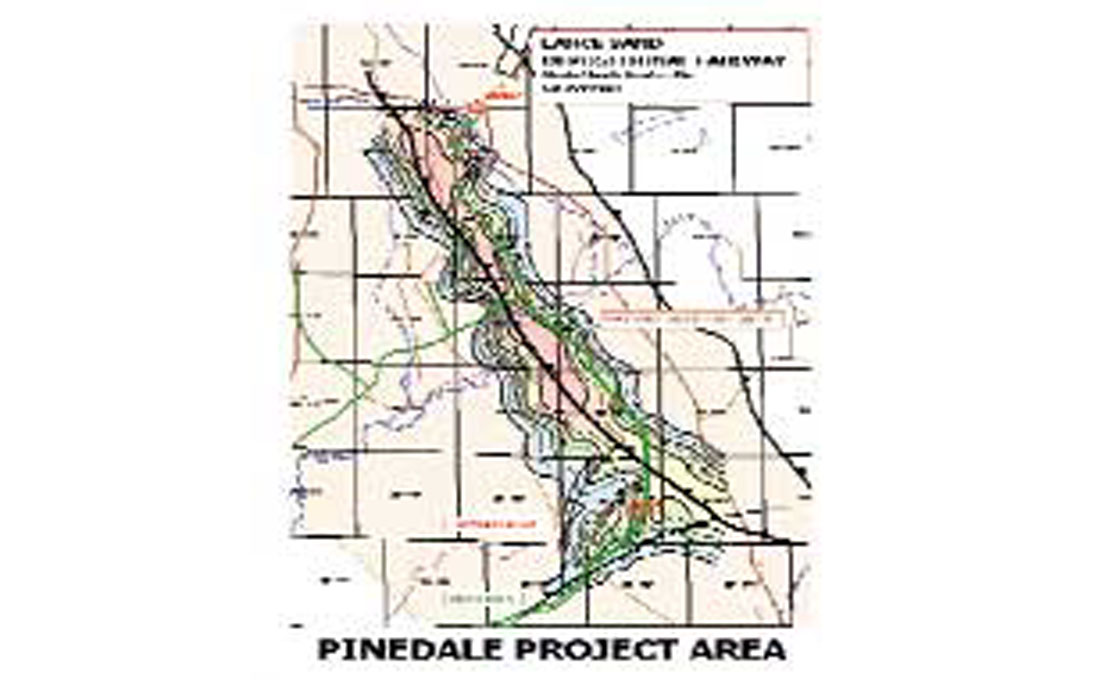
The Pinedale Anticline in Wyoming, USA, has become an area of particular interest since the recent success of several wells that have produced significant volumes of gas from its tight sandstone reservoirs. Production from these reservoirs is now possible using new stimulation techniques developed in the neighboring Jonah Field. The best production rates appear to come from reservoirs that have had their permeability enhanced by natural fractures. Therefore, the ability to detect the presence of natural fractures in the reservoir could have a significant positive impact on the success of future wells. A new seismic attribute uses azimuthal variations in the amplitudes of seismic data at long shot-receiver offsets to identify the presence of open natural fractures. This technique has been used on 50 square miles of Veritas’ 203 square mile, multi-client, Pinedale 3D seismic survey over the Pinedale Anticline to identify the presence of these fractures. The results have been incorporated into a fractured reservoir characterization run for this field. The reservoir characterization is shown to successfully predict early well production by comparison to the production of a successful well drilled shortly after the completion of the reservoir study.
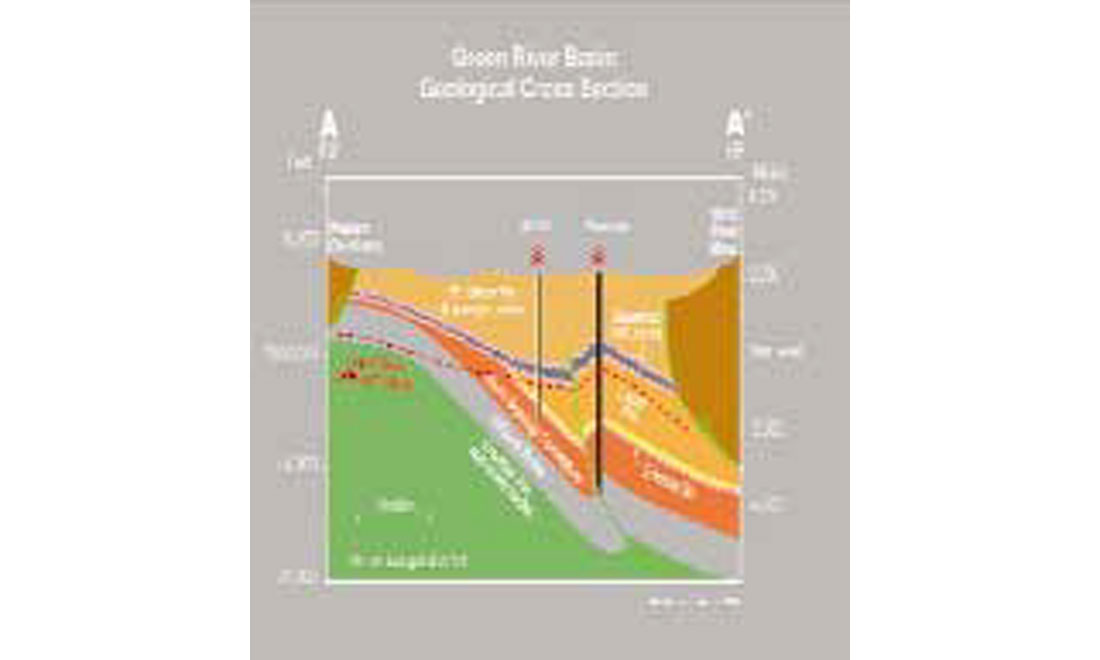
Introduction
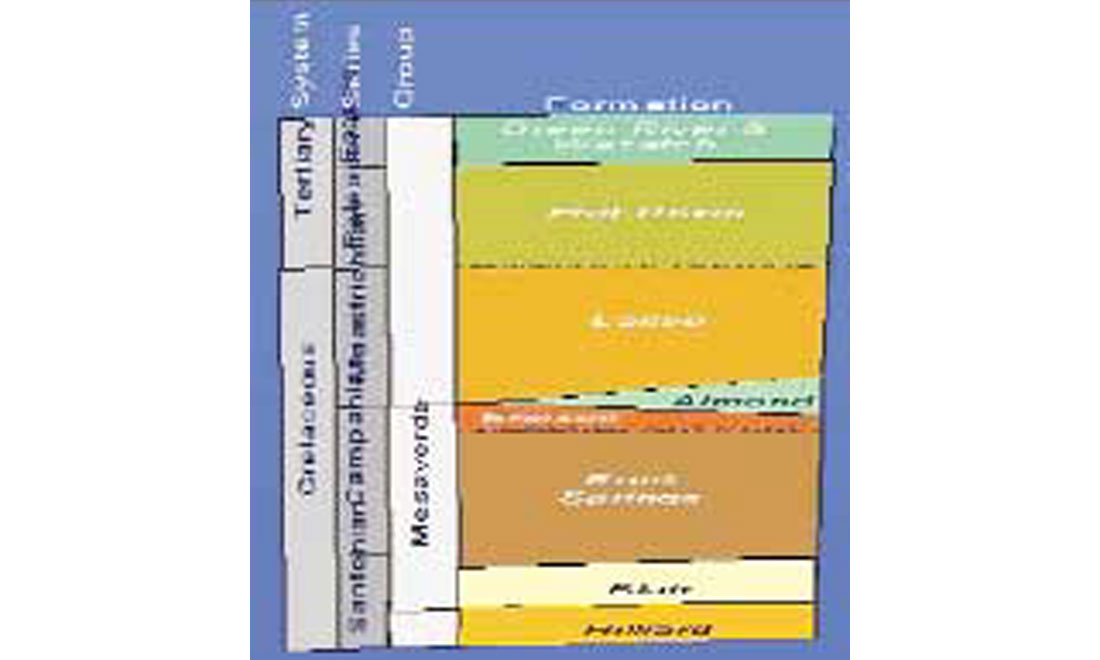
The Pinedale Anticline has been estimated to contain 159 TCF of in-place sweet gas (Law and Spencer, 1989), of which less than 1% has been produced. It is the largest commercial gas accumulation in the Northwestern Green River Basin (Freeman, 1999). Pinedale and the adjacent Jonah field are the fastest growing producing fields in the American Rocky Mountains. The reservoirs currently of interest in the Pinedale Anticline are the tight sands of the Lance and Mesaverde Formations. These units were deposited during a period of rapid sedimentation in the late Cretaceous. Sediments were eroded off the western upland and carried by fluvial systems flowing to the east. Lithologically, the Lance and Upper Mesaverde consist of fluvial channel sandstones and siltstones, floodplain shales, and minor coals. Single sandstone units average 25 feet thick (Bowker and Robinson, 1997; Montgomery and Robinson, 1997). As a result, the areal extent of these reservoirs tends to be limited, and individual reservoirs may not be commercial. However, when several of these sand bodies are stacked vertically, an amalgamated package can be as thick as 100 feet, and viable commercial wells may be drilled into these stacked sands (Gibson). Through the entire sequence of more than 3000 feet, a vertical well may encounter up to 100 individual sandstone units. The Lance and Mesaverde were buried by up to 8000 feet of Tertiary section, which compressed these sands so that they are now tight sandstones with low permeability. Source rocks for these reservoirs include discontinuous coals and carbonaceous material in shales interbedded with the sandstones. The reservoir rocks have moderate porosity ranging from 8-12% and usually have low permeability unless enhanced by natural fractures. Evidence for the presence of natural fractures comes from higher production rates, seen in some of the wells in Pinedale and Jonah, for example the Antelope 15-4 (Shaul, 2000). These production rates would simply not be possible without some kind of permeability- enhancing mechanism such as natural fractures. Therefore, the key to economically producing from these formations in the Pinedale Anticline is to find areas where open natural fractures enhance the low permeability of the reservoir rocks. If a well is drilled near a large swarm of natural fractures, then a hydraulic fracture treatment can connect the wellbore to a larger area of the reservoir.
Current interest has been generated by recent, commercially successful wells drilled by Ultra Petroleum, Western Gas Resources and McMurry Oil, utilizing new stimulation techniques found to be successful at nearby Jonah field. Oil and gas exploration on the anticline has a long and, until recently, relatively unsuccessful history. The first well drilled on the anticline was by the California Company in 1939. Local papers reported the 10,000 foot deep Government #1 exploratory well as a gas discovery. Little additional exploration occurred until El Paso Natural Gas entered the area, drilling nine exploratory wells between 1954 and 1971. The wells encountered significant gas shows in the Fort Union and Lance formations but production rates were disappointing.
An interesting event occurred in 1969. A well drilled on the Pinedale Anticline was the proposed site of an experiment consisting of five separate nuclear explosions in a single wellbore, each of approximately 100 kilotons, from 9,000 to 11,650 feet, to be fired sequentially for the purpose of stimulating production. El Paso drilled the Wagon Wheel #1 well for this purpose to a depth of 19,000 feet into the Hilliard Shale. However, the proposed nuclear explosions were never implemented due to environmental concerns, and the well was reported as completed for 200 MCFD.
Through the 1970s, 80s and early 90s, there was a limited amount of activity on the anticline. Importantly, U.S.G.S. Bulletin 1886 (Law and Spencer, 1989) was published using the results from extensive cores and tests at the proposed nuclear stimulation site. There were no commercial successes until 1997- 98, when new stimulation techniques developed at nearby Jonah Field were successfully used in the Pinedale Anticline. Now there is considerable interest in the gas potential of the reservoirs in this area.
AVAZ Method
It has been shown that open, fluid- (or gas-) filled fractures can be identified through the use of Amplitude Versus Angle and Azimuth (AVAZ) analysis on seismic data (e.g. Gray et al, 1999; Gray and Head, 2000; Hall et al, 2000; Roberts et al, 2001; Gray et al, 2002). This technique uses variations in the amplitudes of the long shot-receiver offsets of P-wave seismic data to determine the intensity and orientation of the fractures. It assumes that the fracturing generates a rock medium that is Horizontally Transverse Isotropic (HTI) – meaning one open set of near-vertical, fluid-filled (or gas-filled) fractures. The method used is similar to the technique described by Jenner (2001) and is based on the Azimuthal Amplitude versus Incident Angle equation of Rüger (1996). This method can be modified to produce attributes that may be useful in the identification of fractures between wells.
The attributes we choose to output are:
- Estimated Anisotropic Gradient
- Estimated Azimuth of Anisotropic Gradient Minimum
- Estimated P-wave Reflectivity
- Estimated S-wave Reflectivity
These attributes are useful because they each contain different information that may be relevant to identification of fracturing. The anisotropic gradient is closely related to seismic crack density (Lynn et al, 1996). The azimuth of the anisotropic gradient is the strike of the fractures in a HTI medium overlain by an isotropic medium. If the reservoir meets this HTI criterion, then this azimuth is the strike of the fractures in the reservoir. The P-wave reflectivity is the response of the rock to compression by the seismic wave and includes information on the rock’s lithology and fluid content. The S-wave reflectivity is the response of the rock to shearing by the seismic wave and is comprised primarily of information about the lithology. This is also one of the first times that the envelope of the Anisotropic Gradient has been used (Todorovic-Marinic et al, 2003). This attribute is similar to the seismic amplitude envelope, in that it removes the effects of the phase of the data. This should result in a more robust estimate of the crack density and better vertical definition of the extent of fractured bodies.
Results
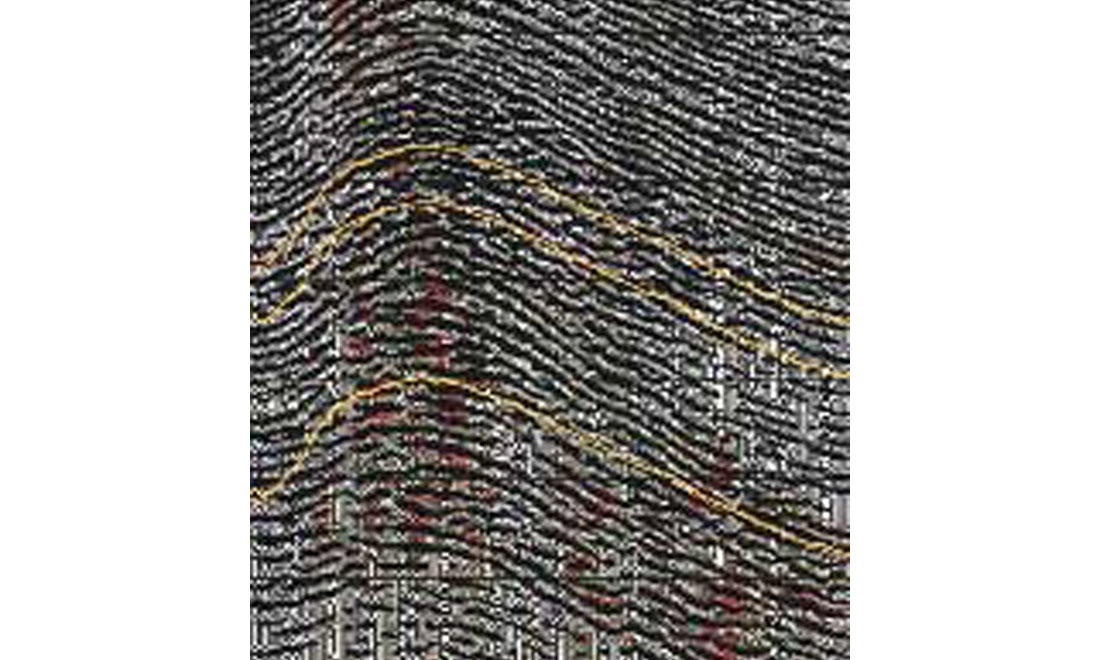
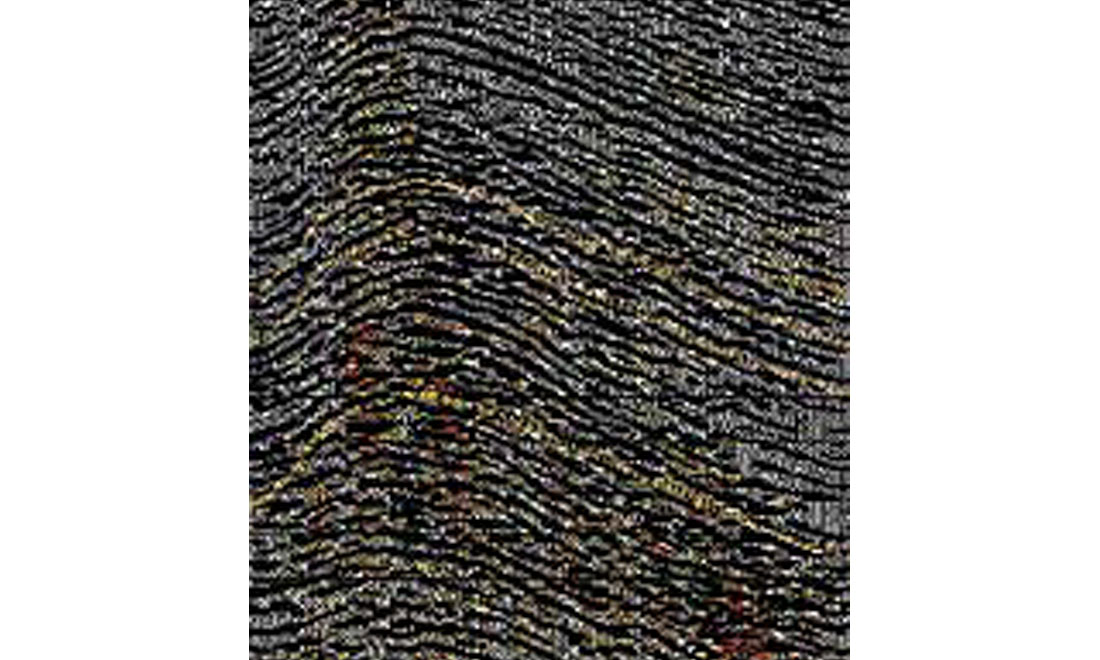
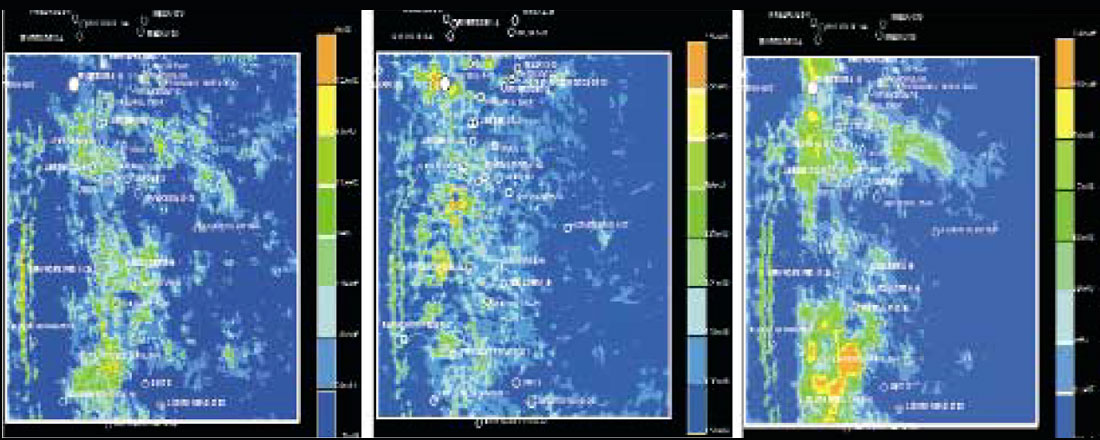
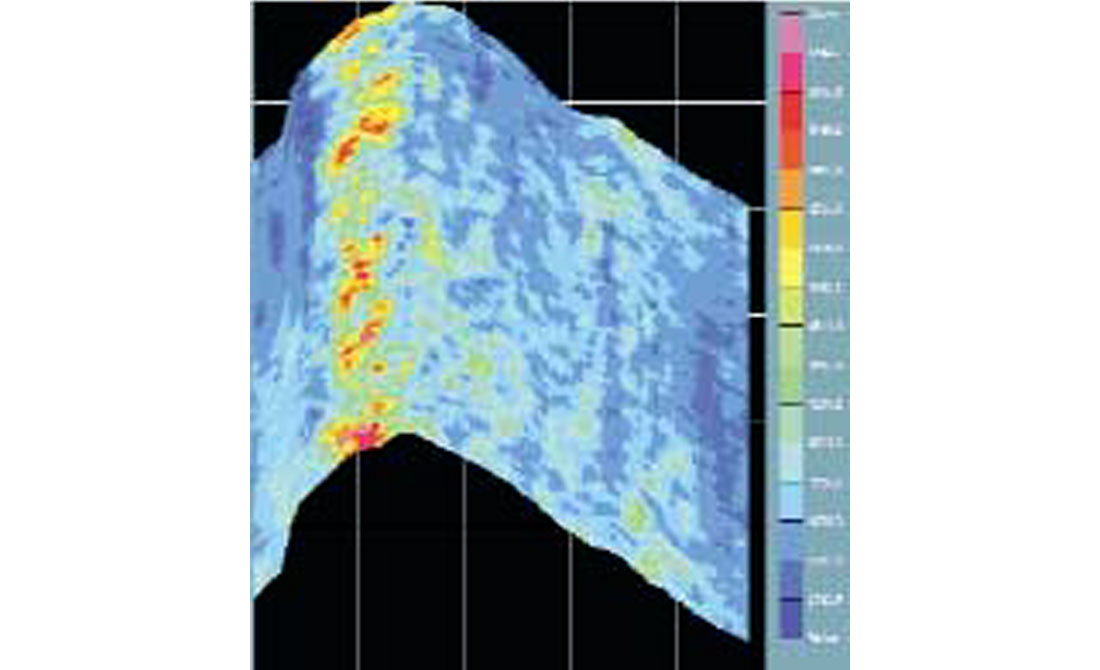
The results of AVAZ analysis on a portion of Veritas’ 3-D multi-client survey are shown below. Figure 4 shows the structural time-interpretation of the Lower Lance over the study area. Figure 5 shows AVAZ results for a zone below the Lower Lance and depicts zones of high intensity fracturing along the top of the anticline. These fractures correspond to an expected zone of more intense fracturing caused by increased stress near the top of the anticline. The highly fractured zones are cut at the fault, west of the crest (Figure 6). Interestingly, in Figure 5, areas of high AVAZ crack density values can be seen extending east down the flank of the anticline in the northern part of the study area. These high values may indicate an area of more intense fracturing on the flank of the anticline, revealing an area where further investigation may prove fruitful.
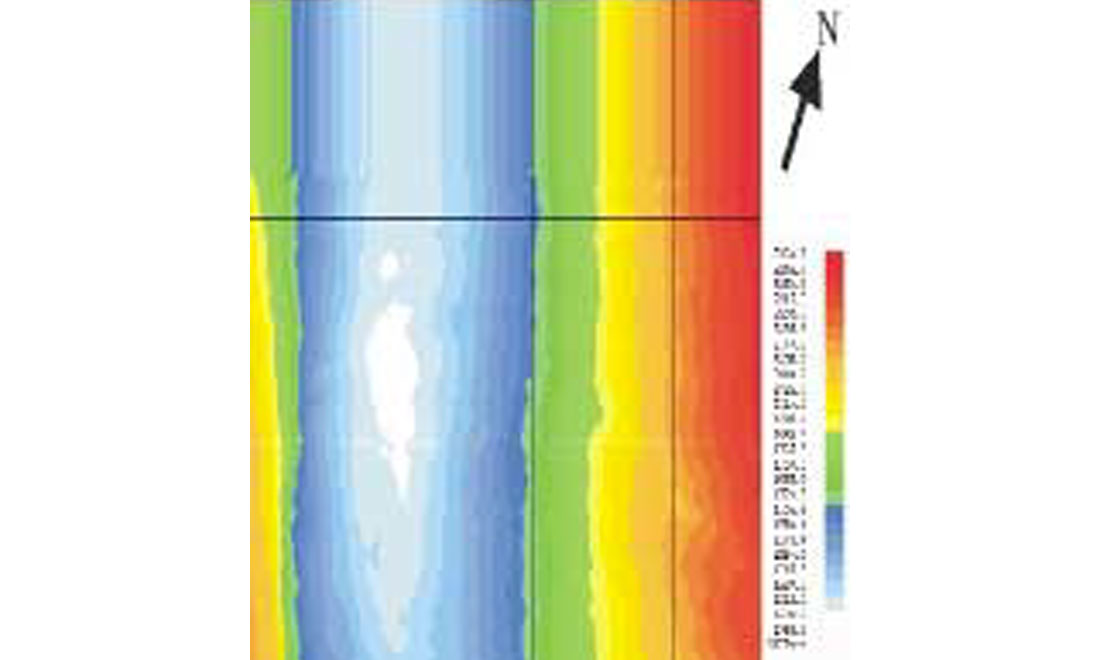
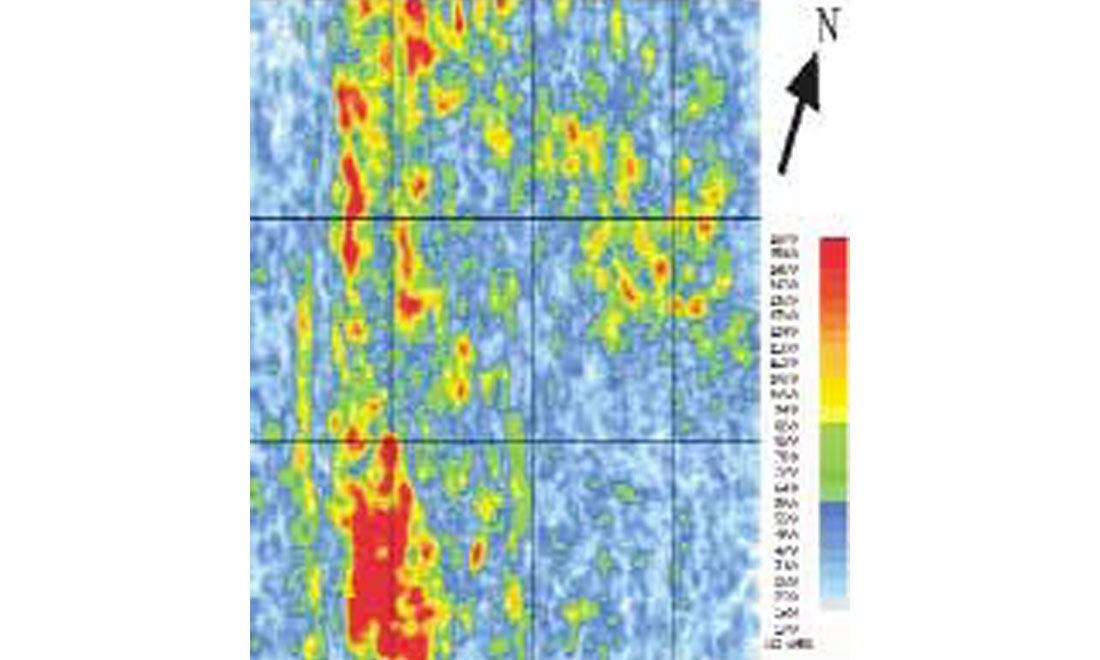
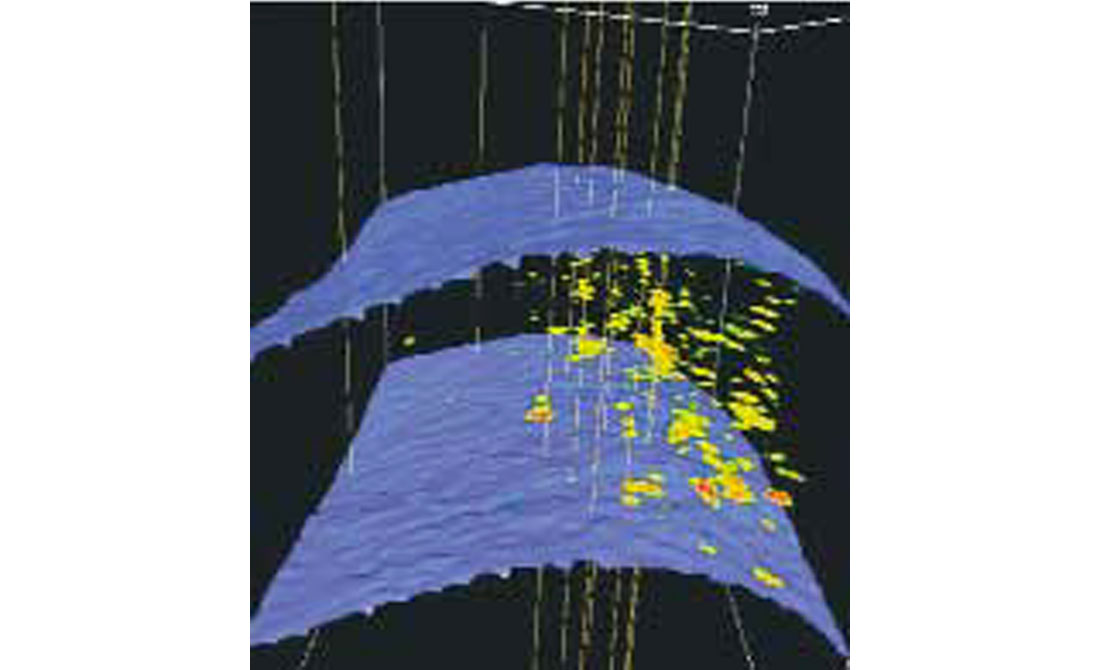
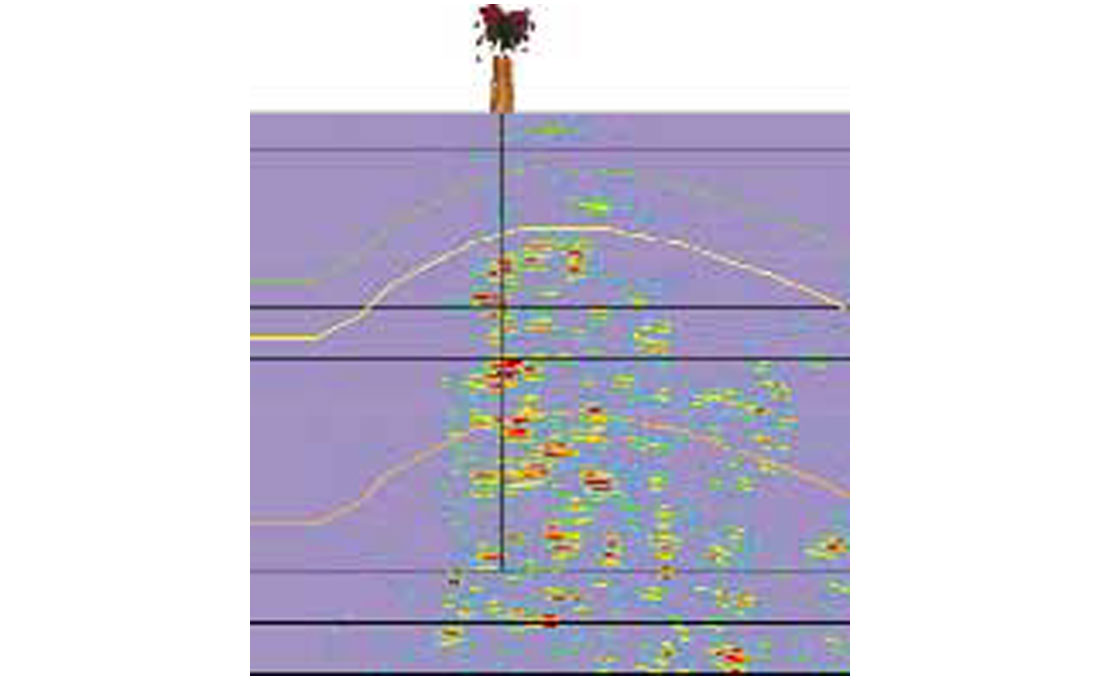
Figure 7 shows the visualization of the results of geobody detection used on zones of high seismic anisotropy that intersect a wellbore. These zones probably indicate swarms of intense fracturing. This visualization technique provides a good estimate of the drainage area of these reservoirs. The drainage area appears quite anisotropic and varies for each geobody. A remarkable feature of this result is the vertical extents of the geobodies correspond very closely with the tops and bottoms of hydraulic fracture treatments. Fracture treatments have been performed in zones in this well where the mud log identifies fractures and sandstone is indicated by the gamma ray log. If the drill bit encounters permeable fractures and if the drilling mud has a pressure greater than the reservoir pressure, the mud spurts into the fractures, causing a spike in the mud log. Thus, the mud log can be a good indicator of fractures. Fracture treatments themselves typically do not have significant effects more than a short distance away from the well, so an AVAZ analysis will not see their effects for typical seismic data due to its limited spatial resolution. What this suggests is that these AVAZ results, which indicate the presence of fractures, are actually indicating the presence of fractured sandstones reservoirs in the Pinedale Anticline Field. If the Anticline’s tight sands are more brittle than the more ductile, surrounding shales, this observation makes sense. Thus, it may be possible to use AVAZ to predict the presence of the fractured sandstones that are the reservoirs in this formation.
Extending this analysis throughout the 50 square miles analyzed for AVAZ in the Pinedale 3D, it can be seen in Figure 8 that the majority of these fractured sandstones exist to the west of the top of the anticline, where few wells have been drilled. This region sits structurally in an area between the top of the reservoir and a fault to the west (as seen on the right side of Figure 8). This would likely have been an area of high stress. Also, there are some indications this fault may have been active during the deposition of the Lance formation resulting in a possible preferential deposition of sands just to the east of the fault, exactly where the AVAZ crack density anomaly now exists. Strong estimated shear-wave amplitudes in the same region (shown in Figure 6b) correspond to the locations of high values of crack density. Strong shear-wave amplitudes should correspond to areas of more sand in this reservoir, since the shear-waves react primarily to the rocks and not the fluids, and sands typically have higher shear rigidity than shales. Therefore, these shear-wave amplitudes tend to affirm preferential sand deposition in this area. It can also be seen in Figure 8 that the majority of the wells have been drilled along the top of the anticline. Note that only a few have intersected areas of high seismic anisotropy and all that do only do so at the edge of the AVAZ crack density anomaly. From these results, it is clear that the AVAZ crack density attribute is adding new information about the Pinedale Anticline reservoirs.

Fractured Reservoir Characterization
Recently, it has become possible to incorporate AVAZ attributes into reservoir characterization (Boerner et al, 2003). This result is extremely important because it allows for better determination of fracture information between the wells and thus a better understanding of fluid flow in the reservoir. Historically, fractured reservoir characterization has been done with well information and indirect measures of fracturing between the wells, such as curvature, distance from faults and lithology. The seismic AVAZ results provide a direct measurement of the effects of fractures between the wells. However, these results have been difficult to tie to well control in the past due to the paucity of direct fracture indications at the wells. This causes difficulty in relating the seismic anisotropy measurements to the fractures because of this limited well control. Boerner et al (2003) use the SUREFrac neural network reservoir characterization tool (Ouenes and Hartley, 2000) to predict the fracturing in the Pinedale Anticline reservoir, incorporating the AVAZ attributes with those mentioned above. This tool has several advantages for the difficult problem of characterizing a fractured reservoir:
- It uses a non-linear neural network especially designed for fractured reservoirs.
- It allows for the calibration of the various input attributes to the fracture output. 3.Based on the best ranked of these attributes, multiple realizations of reservoir simulations were generated by the SUREFrac neural network. Realizations were created both with and without the AVAZ attributes, with all other attributes remaining the same.
- It allows for the use of seismic attributes.
- It ranks the various inputs on their relative ability to predict the fractures, in order to determine which attributes are most important in predicting fractures in a given reservoir.
- Its output is suitable for incorporation into common commercial reservoir simulators.
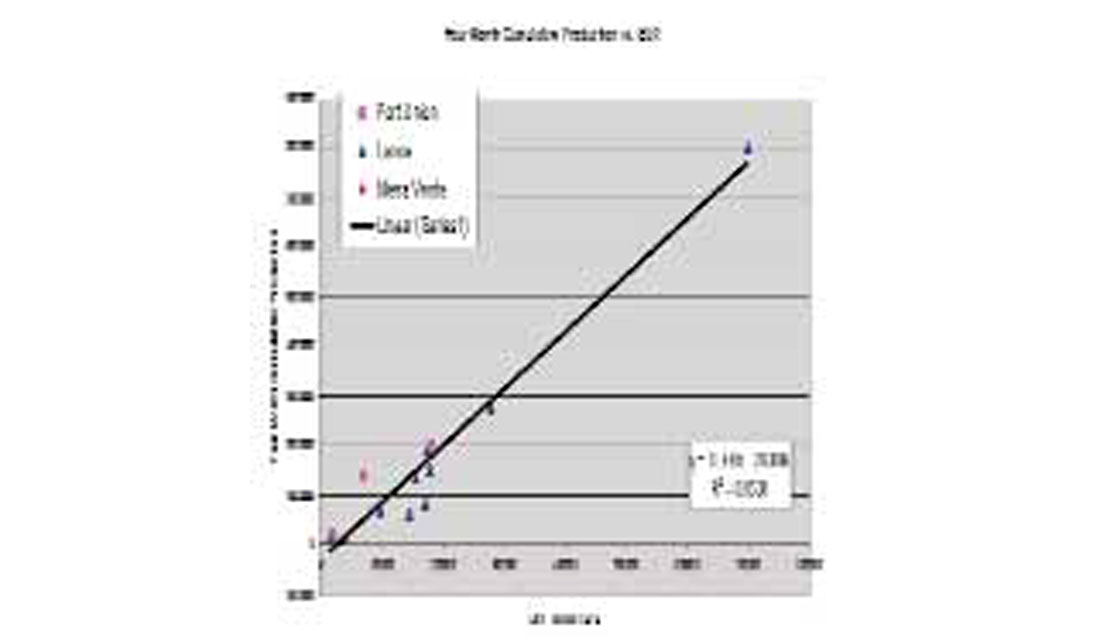
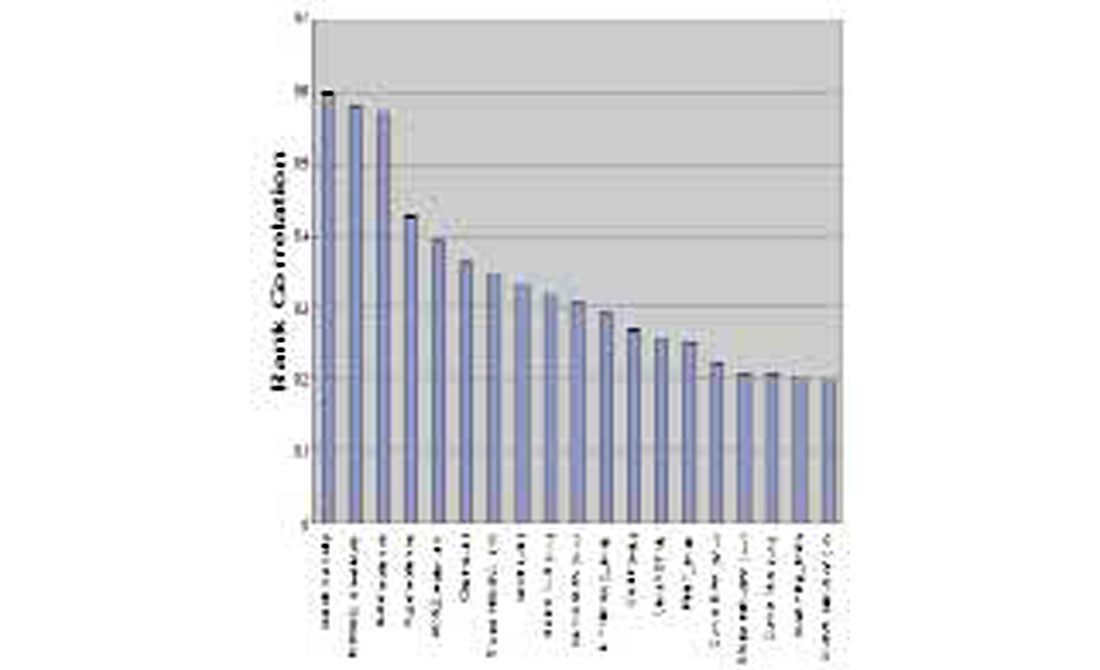
SUREFrac is used by first identifying a fracture indicator (FI) and then ranking the variety of inputs that the geoscientists and engineers familiar with the field suggest may have influence on it. For the Pinedale Anticline Field, four-month cumulative production is chosen as the fracture indicator. This is the best indicator of fractures in this field due to the paucity of good well information on the fractures and limited production from the recent, better wells. The field has very few long-term producers since the aforementioned new completion techniques, and the clearance of some environmental issues, have only recently revitalized it. The FI correlates well to Expected Ultimate Recoverable (EUR,) a measure that is often used as a fracture indicator (Figure 9). The AVAZ and other seismic attributes were used as inputs to SUREFrac’s ranking process along with geologic models of porosity, net-to-gross, and coal and the structural interpretation. The geologic information was derived from the analysis and interpretation of wells available in the public domain and from the Veritas Pinedale 3D seismic survey. The rankings of the most important of the inputs to SUREFrac in predicting the FI are shown in Figure 10. The crack density (AVAZ amplitude) and its envelope are the most important attributes in these rankings; more important than the next attributes, the semblances, which are commonly used for fracture detection.
Based on the best ranked of these attributes, multiple realizations of reservoir simulations were generated by the SUREFrac neural network. Realizations were created both with and without the AVAZ attributes, with all other attributes remaining the same.
Based on this fractured reservoir characterization, we predicted in July 2002 that Ultra Petroleum’s Riverside 4-10 well, then being drilled, would be among the best producers from the Pinedale Anticline Field. The Riverside 4-10 well had initial production (IP) of 13.6 MMCF, produced 461 MMCF in its first four months (our FI) and produced 756 MMCF of gas in the seven months from July 2002 to February 2003 (http://wogcc.state.wy.us/Wellapi.cfm?Oops=ID30173&nAPINO=3522704.0). The best well in the field to date is the Riverside 1-4 well that produced 699 MMCF in its first four months of production (http://wogcc.state.wy.us/ Wellapi.cfm?Oops=ID30173&nAPINO=3522590.0). Thus the production from the Riverside 4-10 well confirms our prediction. Furthermore, the reservoir characterization using AVAZ (shown on the right of Figure 11) suggests the high FI indicated at the Riverside 4-10 well may continue to the excellent wells, including Riverside 1-4, just outside our study area to the North. Using the attributes traditionally used to identify fractures in this reservoir, the reservoir characterization indicates the Riverside 4-10 well should produce only 2 MMCF in 4 months. Since this well had an IP of 13.6 MMCF, this result is clearly incorrect. The reason for the error can rapidly be established. Since this is a relatively new field, it is subsampled by the wells; most of the wells drilled to date have been drilled on the top of the anticline. It turns out most of the wells previously drilled on the flanks of the anticline have been relatively unsuccessful. Therefore, in any statistical analysis, there is a bias towards wells on the top of this structure because all previous successful wells have been structurally high. The Riverside 4-10 well is located down-flank between the top of the structure and the fault to the west in an area the AVAZ analysis has identified as being more highly fractured. Incorporation of the production from this well shifts the major production to the west between the top of the anticline and the western fault. Through the incorporation of the AVAZ crack density attribute, which is high in the region where this well has been drilled, the neural network has been able to extrapolate the successes on the top of the structure down-flank to where this well has been drilled.
Future Work
The next step is to incorporate recent well information to further refine the estimates of the FI and to extend this analysis to the rest of the Pinedale Anticline Field and its neighbour, Jonah Field. This involves:
- An AVAZ analysis over the remainder of the suitably acquired, wide-azimuth, seismic surveys.
- Petrophysical analysis of the public-domain wells outside the study area as well as new wells drilled since the completion of this study.
- Working with the geoscientists and engineers of oil and gas companies with interests in this field to refine our geologic model.
- Confirm the SUREFrac rankings over the larger survey area and include the new wells and seismic attributes over the entire volume.
- Run multiple SUREFrac neural network realizations over the entire field.
Discussion
AVAZ analysis has been shown by many authors to provide good estimates of fracture azimuth and intensity at the locations of wells; e.g. Roberts et al (2001), Smith and McGarrity (2001), Gray and Head (2000), Hall et al (2000), Gray et al (1999) and Lynn et al (1996). Because the results appear to be reasonable at well locations, it is inferred the AVAZ attributes can be trusted to estimate these parameters between wells.
In the Pinedale Anticline area, high production rates in some wells indicate natural fractures play a significant role in enhancing permeability. The AVAZ technique is shown here to identify the presence of fractures in locations where they are expected in the Pinedale Anticline. The AVAZ crack density results indicate that the most intense fracturing occurs in sand bodies and less fracturing occurs in the shales. Thus, the crack density measurement – approximately Rüger’s anisotropic gradient – can be used to distinguish between fractured sandstone and shale lithologies in this field. This effect has been observed in other reservoirs (e.g. Gray et al, 2002; Bunge, 2001). Since gas charge is not a problem in the Pinedale Anticline Field, the most important factor is lithology. Zones of high crack density, estimated using AVAZ, may indicate zones of thicker sandstone deposition and, therefore, preferred drilling locations.
Zones of high crack density, indicated by AVAZ analysis, correlate with production from the wells and the shear reflectivity derived as part of the AVAZ analysis. This indicates that the crack density attribute shows the presence of gas-charged fractured sand bodies in the Pinedale Anticline Field. Visualization of stacked zones of higher crack density suggests most wells should be drilled vertically and in some places, slight deviations from the vertical may provide for better wells.
Fractured reservoir characterization has been carried out over the 50 square miles of the Pinedale 3D survey analyzed using AVAZ attributes. Since this is a new field with limited production and well control, the best fracture indicator has been chosen to be four-month cumulative production. The changes in the fracture indicator due to incorporating the AVAZ attributes show they provide important new information about production in this reservoir, which improves the reservoir characterization. The SUREFrac reservoir characterization provides a prediction of the fracture indicator that has been confirmed by the success of Ultra Petroleum’s Riverside 4-10 well, which was drilled at the location of an AVAZ high and is one of the best producing wells in the field.
Since there are now many more wells available than when this reservoir characterization was done, including many intersecting strong AVAZ anomalies, improvements to the existing reservoir model are now possible. These improvements can be made by incorporating the new well information and including AVAZ analysis on all the seismic data available over the Pinedale Anticline Field. Incorporation of the knowledge of the geoscientists and engineers of those companies with interests in this field will also allow the opportunity to improve upon the current reservoir characterization.

Acknowledgements
The authors wish to thank the following people and organizations without whose assistance this work would not have been possible: Abdel Zellou, John Robinson, Mark Lahr, Brad Bankhead, Rick Trevino, Ahmed Ouenes, Patrick Wong, Leonhard Ganzer, Jeff Harwell, Dave Purcell, Scott Cheadle, Ken Tubman, Sue Bigham, Sue Rezai, Jamie Gray, Placer Deguzman, Veritas Land Surveys and Veritas Exploration Services.


Join the Conversation
Interested in starting, or contributing to a conversation about an article or issue of the RECORDER? Join our CSEG LinkedIn Group.
Share This Article