Summary
The purpose of this presentation is to provide an overview of how well AVAZ (Amplitude Versus Angle and aZimuth) extractions from P-wave seismic data compare to more widely accepted measurements of fracture density and fracture strike. Such measurements come from core data, structural interpretations, and curvature, Formation Micro-Imager (FMI) logs, production, cross-dipole logs, standard well logs (e.g. gamma ray, sonic, density, etc.), lithology, bed thickness, multicomponent seismic data, etc. The authors have the advantage of having seen more than 60 examples of AVAZ analysis to date, where there is a common correlation of the fractures observed in AVAZ with other measures of fractures. This presentation shows examples of some of these correlations between the AVAZ seismic attributes and other measurements of fractures in the reservoir. The examples come from the Manderson Field in Wyoming, where the reservoir is a fractured carbonate in an asymmetric anticline; the Weyburn Field in Saskatchewan, where the reservoir is a flat-lying carbonate fractured by reactivation of basement faults and salt dissolution; and the Narraway Anticline, a tight gas-sand reservoir in the Alberta Foothills.
Method
The AVAZ method is a sample-by-sample fitting of the amplitudes in the prestack seismic gather to an equation derived by Rüger (1996), who shows that the AVO gradient can be split into both isotropic and anisotropic parts for a Horizontally Transversely Isotropic (HTI) medium. Such a medium can be created by a swarm of open vertical fractures encased in an isotropic background material. If an azimuthally isotropic material overlies this layer, then Rüger’s equation indicates the fracture properties of the underlying fractured medium and the anisotropic part of the AVO gradient describes the strike and crack density of the fractures.
Examples
Some examples correlating AVAZ results with those from other methods of measuring fractures are shown. These examples give a sense of the robustness of the AVAZ method in predicting fracturing.
It should be noted that AVAZ assumes the medium is approximately HTI. That is, in theory, AVAZ can detect only sets or swarms of vertical fractures that are oriented in the same direction. Why, then, is AVAZ often successful at indicating multiple fracture sets at depth? This AVAZ robustness may be explained by considering differential horizontal stress fields at depth. At significant subsurface depths this explanation seems reasonable because the large vertical and horizontal stresses at these depths can interact with the existing fracture sets, tending to preferentially open one fracture set, thereby making the fractured rock approximately HTI.
Manderson Field, Wyoming, USA
Gray and Head (2000) describe the AVAZ analysis applied to a 3D survey over the Manderson Field. The Manderson Field is located on an asymmetric plunging anticline in the Big Horn Basin of Wyoming. The producing zones encompass Pennsylvanian, Permian and Cretaceous rocks that produce oil and gas. The reservoir examined using AVAZ is the fractured carbonate of the Permian Phosphoria formation lying at a depth of 6400-9000 feet below the surface. This is the most productive zone on the anticline to date. The Phosphoria at Manderson Field is a medium-to-thick bedded carbonate sequence. These rocks have low matrix porosity yet strong pressure support, with several wells that have produced substantially more oil than was originally thought to be in place. All of this suggests that there is significant fracturing in the Phosphoria with significant lateral connectivity. The Phosphoria overlies the fractured aeolian dolomitic sands of the Tensleep formation, which will also be examined.
There is a wealth of geologic information about the fractures both in and around the Manderson field. Oriented core studies are available for three wells that fall within the bounds of the 3D survey used in the AVAZ analysis. Nearby, the reservoir rocks outcrop; these outcrops have been examined for their fracture characteristics in a geologic study. In addition, outcrop analogues are used to understand the fracture information being provided by the AVAZ analysis. All of this geologic information can be compared to the fracture information derived using AVAZ at Manderson Field to determine if it has been successful.
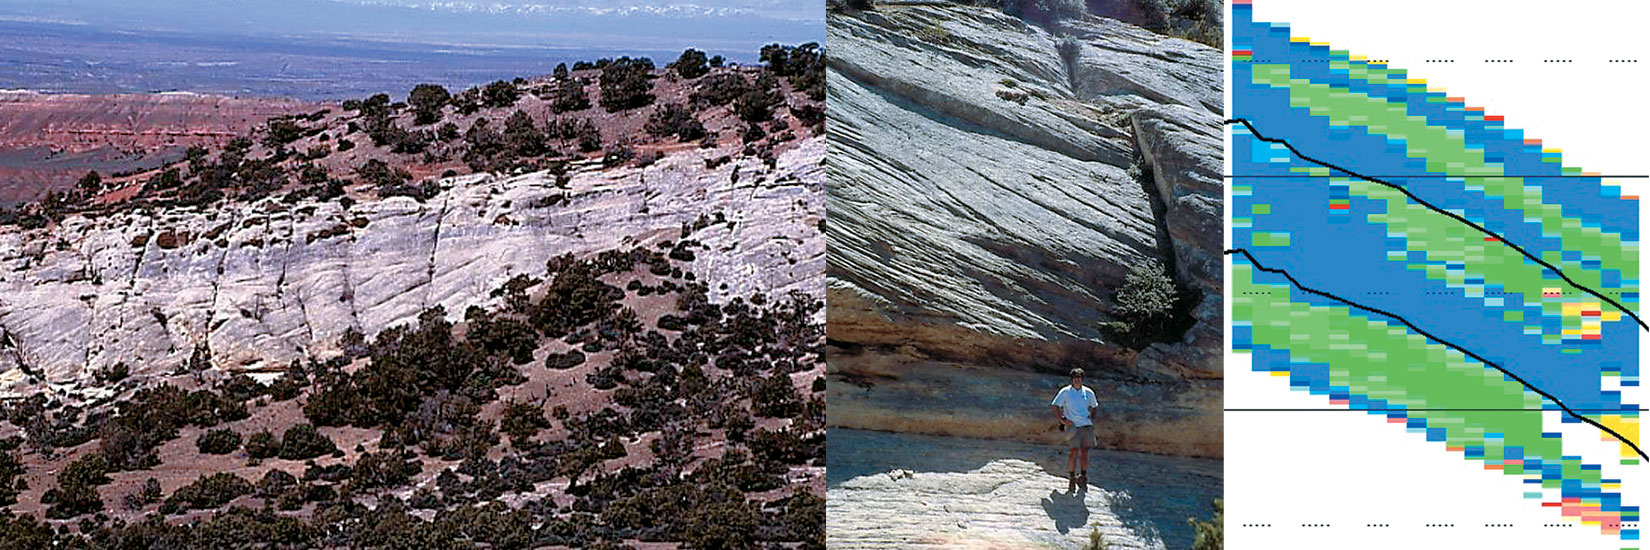
An example of such a comparison is seen in Figure 1. On the left is a photograph of a cliff that cuts part of Zeisman Dome, 10 miles SE of Manderson Field. The white rock is the Tensleep dolomitic sands. Large-scale, vertical, E-W fractures can be observed in the cliff face. The fractures in the formations above and below the Tensleep tend to be NW-SE. In the center is a photograph of a recessed portion, a few feet thick, at the base of the Tensleep, which is much more mechanically weak (and, as evident in the photo, more susceptible to erosion) than the rocks above or below it. These weak rocks form a mechanical boundary within the Tensleep, which is much more mechanically weak (and, as evident in the photo, more susceptible to erosion) than the rocks above or below it. This isolates the Tensleep from the rocks below it, explaining the different orientations observed in outcrop. On the right is a section of ‘fracture strike’ as estimated using AVAZ on the 3D over the Manderson Field. The green zones correspond to an E-W fracture strike and the blue to a NW-SE fracture strike. The green zone at the base of this image corresponds to the E-W fractures observed in outcrop in the Tensleep formation. The black line at the top of this green zone is the top of the Tensleep, picked independently on the seismic stack. This pick corresponds closely to the indicated change from a NW-SE to an E-W fracture strike. The change from green to blue at the very bottom of the fracture strike section corresponds to the change in fracture orientation observed in outcrop in the mechanically weak zones shown in the central photo. Thus, there is an excellent correlation between the AVAZ seismic attribute generated from azimuthal variations in reflections from rocks buried at a depth of 7000 feet and outcrop of the corresponding formation at Zeisman Dome. This along with ties to other geologic information at Manderson Field generates significant confidence that the AVAZ analysis is measuring real fracture properties.
Weyburn Field, Saskatchewan, Canada
Weyburn Field was discovered in 1955. It is situated in southern Saskatchewan in the northern part of the Williston Basin. Ultimate recovery for this reservoir is estimated to be greater than one billion barrels of oil. The oil is produced from the Mississippian-age Midale formation, which consists of two major lithofacies called the Vuggy and the Marly. The Vuggy is a shoal – intershoal carbonated environment with moderate porosity (8-20%) and permeability (10-300 mD), which appears to be enhanced by natural fractures. The Marly is a relatively porous interval (16-38%) with poor permeability (1-50 mD). Overlying the Marly is the Midale evaporate, which forms the seal for this reservoir (Maxwell et al, 2004). Gray et al (2002) describe AVAZ analysis on the P-wave part of a 9C 3D shot by Colorado School of Mines in the Weyburn Field.
At Weyburn there are many wells that penetrate the reservoir and extensive core has been taken. Many of the wells have associated well logs, including some cross-dipole logs, which should be a direct measure of seismic anisotropy. Bunge (2001) did a geologic study showing that the fractures in the Midale can be observed and interpreted from both core and FMI logs. He shows three major fracture trends in the NESW, NW-SE and N-S directions. The NE-SW fracture set is shown to be the dominant one, which is in agreement with production in the field. There is a long production history that includes a waterflood that has been ongoing since the 1960’s and the recent initiation of a miscible CO2 flood to flush attic oil in the Marly zone. There are also VSP data and timelapse 3C and 9C – 3D seismic surveys with which to compare the AVAZ analysis. Reasoner (2001) interpreted both P-P and S-S data from the 9C survey and showed that the fracturing observed in the reservoir is related to both reactivation of basement faults and differential dissolution of the underlying Prairie Evaporite section underneath the area of the 3D.
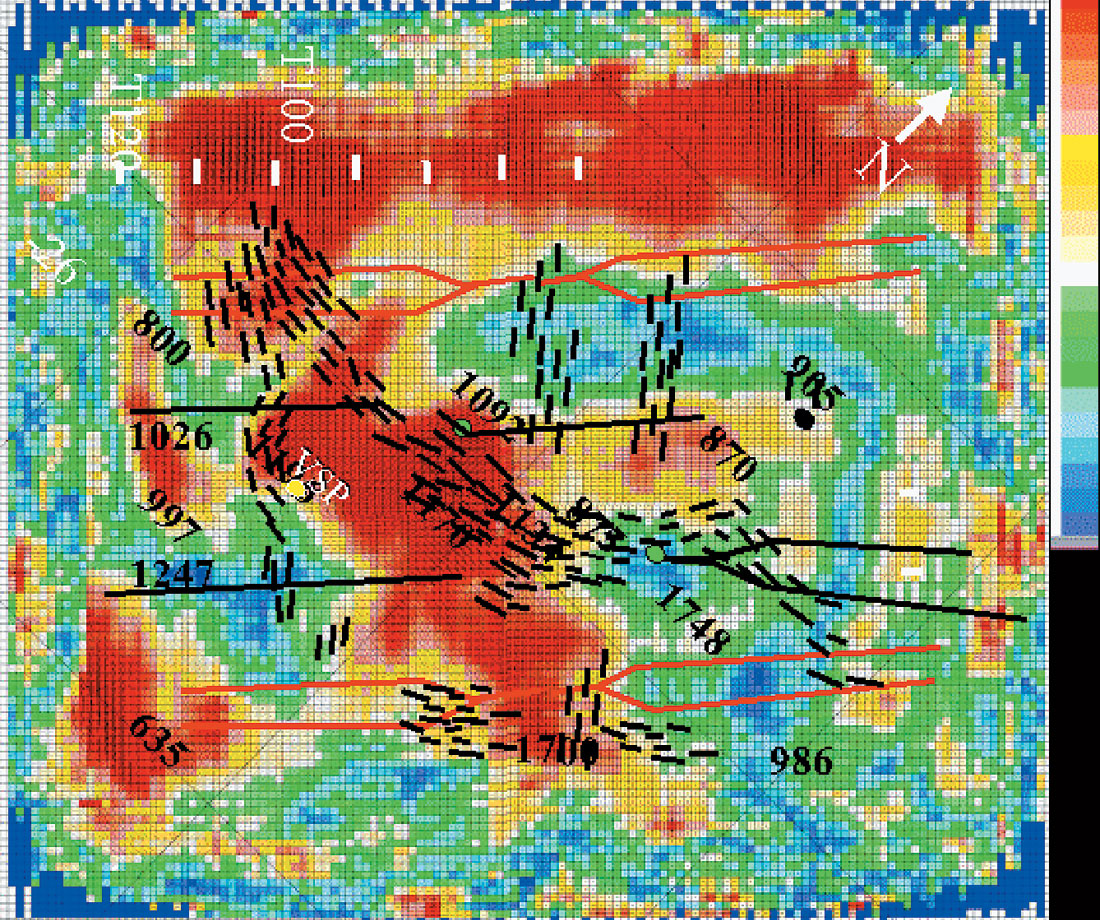
The various data generally agree regarding the orientation of the fractures in this reservoir. An example of the correlation between different datasets is shown in Figure 2, where the AVAZ analysis is overlain by Reasoner’s (2001) interpretation of the S-S amplitude differences derived from a 9C survey over part of the reservoir. The general trend through the middle of the survey observed by Reasoner is the same as is seen in the AVAZ analysis. The zone of high fracture density shown by the AVAZ around the outside of the figure is in a zone that had S-S fold too low to be interpreted and so cannot be compared.
Narraway Anticline Field, Alberta, Canada
Todorovic-Marinic et al. (2004) describe the application of AVAZ to the Narraway Anticline Field. The Narraway Anticline is a NW-SE trending anticline occurring in the Foothills disturbed belt of western Alberta. Current production from the anticline is about 100 MMCF/D from multiple formations of Cretaceous and Pennsylvanian age. This analysis focuses on the ‘G’ sand of the Cretaceous Falher zone, which accounts for 20% of the production on the anticline. The productive unit is tight shoreface sandstone located at the top of the ‘G’ sequence. This sandstone has less than 5% porosity and very low permeability and is quite hard. Two wells on the anticline generate the bulk of the production from the Falher ‘G’; both had initial production in excess of 20 MMCF/D as compared to other wells that produce an order of magnitude less. There are no direct measurements of the fractures in the reservoir, so production is one of the available measures of the success of the AVAZ technique. It is assumed that better production occurs when wells encounter large swarms of natural fractures.
Narraway anticline is typical of many AVAZ analysis projects in that there is little direct measurement of the fractures in this relatively new reservoir. Consequently, reliance must be placed on commonly available information such as the structural interpretation, production, and commonly measured logs like the gamma ray to validate the AVAZ results.
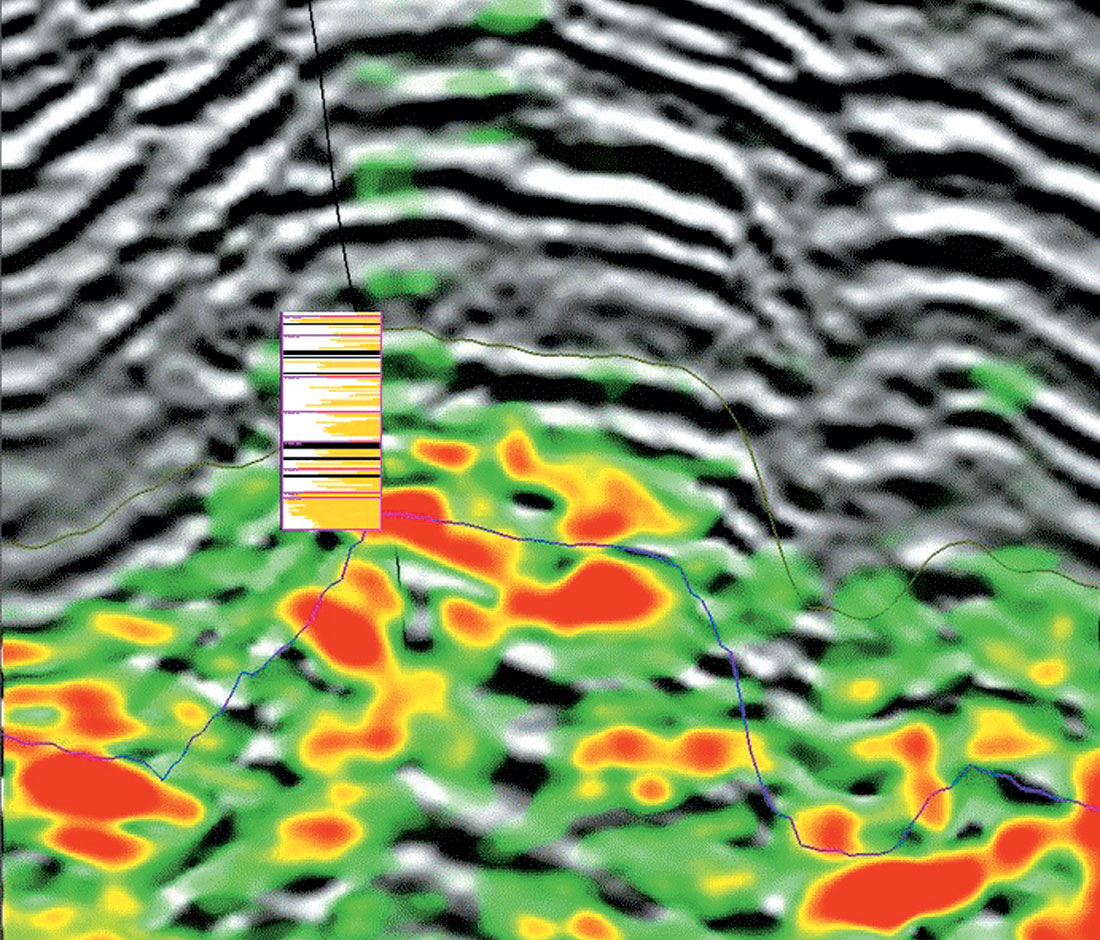
Figure 3 shows a commonly observed phenomenon that is also observed in the Falher ‘G’ at Narraway. In clastic sequences, areas of higher crack density tend to be associated with sands and lower crack density is associated with shales. This observation can be explained by greater ductility of shales compared to sands. Sands will tend to fracture more easily given the same stress load. This has been observed by House et al. (2004) who suggest that induced fractures stay within the sandier interval of the reservoir during hydraulic fracturing at Jonah Field. In addition, there tends to be a correlation of the zones of high crack density with structural features, such as faults and areas of high curvature in folds. At Narraway, a combination of these two effects is observed. These correlations are strong indications that the seismic AVAZ analysis is indicating the presence of fractures in the rock.
Discussion
These examples show that AVAZ does relate to other sources of information about the fractures. At Manderson, the AVAZ results tie various other measures of fractures in the reservoir, including the outcrop shown in this paper. Examples of the tie of the AVAZ results to other measurements of fractures are shown in the presentation. At Weyburn, the AVAZ analysis also ties various measurements of the fractures, including the SS seismic amplitude interpretation shown in this paper. Comparisons of the AVAZ results at Weyburn to some of these other measures are shown in the presentation. At Narraway, the AVAZ results have been shown to tie the lithology. These results also have a good correlation with production from wells in this field.
Results of more than 60 AVAZ analyses show, where the results have been communicated, that 75% of these AVAZ analyses have successfully identifed the fractures or predicted a successful well. The largest cause of the breakdown of the AVAZ technique was found to be error caused by amplitude variation created by the acquisition footprint. Using a simple screening procedure before AVAZ analysis weeds out most of these problem datasets. Other problems are caused by noise in the seismic data, where an AVO gradient cannot be determined reliably, and the HTI assumption in areas where the rocks are so broken up that the horizontal stress fields cannot close them such as in heavily karsted areas (e.g. Soto- Aguila et al, 2003) and close to faults. In the latter case, the recommended procedure is to use the AVAZ attribute in combination with other seismic attributes that have traditionally been used. Of particular usefulness are measures of discontinuity in the seismic, which appear to provide information in areas where the HTI assumption is invalid, e.g. Soto-Aguila et al (2003) and Gray et al (2003).
There are many other examples of successful use of the AVAZ technique, these include: Al-Hawas et al. (2003), Soto-Aguila et al. (2003), Hall et al. (2000), Roberts et al. (2001) and Al-Marzoug et al. (2004). They show that the AVAZ technique is being increasingly used and that it has proven successful throughout the world for the characterization of fractured reservoirs.
Conclusions
AVAZ provides useful additional information from 3D, P-wave seismic data that can help in the determination of fracture strike and crack density, and frequently lithology, provided the assumptions of the method approximately hold. The AVAZ information must be incorporated with other information about the fractures in order to obtain a more complete understanding of the fracture system in the reservoir of interest.


Join the Conversation
Interested in starting, or contributing to a conversation about an article or issue of the RECORDER? Join our CSEG LinkedIn Group.
Share This Article