Abstract
Simultaneous extraction of oil and sand during the cold production of heavy oil generates high porosity channels termed “wormholes”. The development of wormholes causes reservoir pressure to fall below the bubble point, resulting in dissolved-gas coming out of solution to form foamy oil. Amplitude anomalies in the vicinity of the borehole observed in time-lapse seismic surveys are possibly a result of the presence of foamy oil and wormholes. Time-lapse results can be used to image the drainage pattern for infill drilling designs. Through time-lapse seismic modeling, we conclude that PP reflections may be useful for foamy oil while PS reflections may be useful for detecting a high density of wormholes.
Introduction
Cold production of heavy oil is a non-thermal process, in which sand and oil are produced simultaneously. This process has been economically successful in several heavy oil fields in Western Canada. The extraction of sand creates a wormhole network and a foamy oil drive. These two effects are thought to be the main influences in enhanced oil recovery.
Wormhole Networks
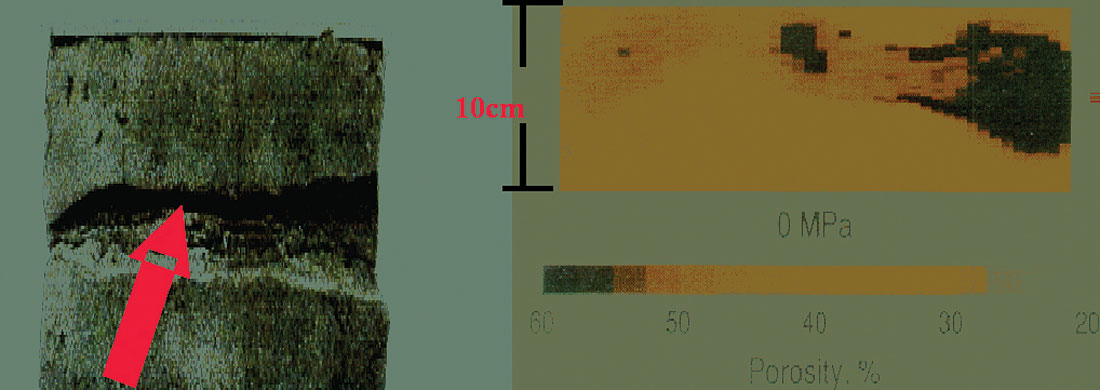
The cold production process is a pressure driven process, in which both heavy oil and sand are transported to the surface using a progressive cavity pump. This extraction causes high pressure gradients in the reservoir resulting in the failure of the unconsolidated sand matrix. The failed sand flows to the well, triggering the development of wormholes. Sawatzky et al, (2002) believe that wormholes grow in unconsolidated, clean sand layers within the net pay zone, along the highest pressure gradient between the borehole and the tip of the wormhole. These grow in a radial pattern to a distance of 150 m or more from the wells, forming approximately horizontal high permeability, porosity channels in the reservoirs. Laboratory experiments conducted by Alberta Research Council (Tremblay, et al 1999) indicated that the porosity of mature wormholes could reach 50%, and the wormhole diameters could range from the order of 10cm to one meter (Figure 1).
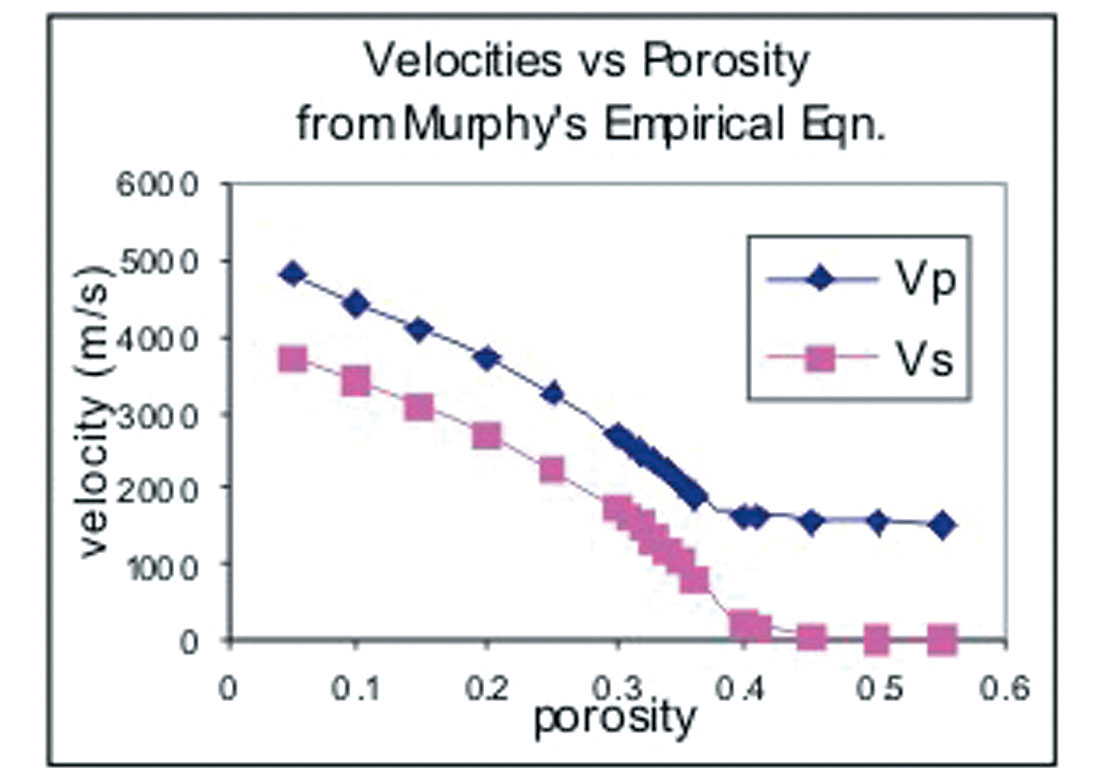
With porosities greater than the critical porosity, macroscopic effects of wormholes on P- and S-wave velocities of the reservoir rock can be observed, when large amount of sands are produced, and a high density of wormholes exist. Here, the critical porosity can be thought of as a critical value to separate the compressibility and rigidity of saturated rocks into two distinct domains: frame-supported and fluid-supported. Individual wormholes cannot be imaged as their diameters are of the order of centimeters, much lower than the resolving ability of typical seismic frequencies. 2D numerical models designed to examine cumulative effects of wormholes using both PP and PS seismic data indicates that PS data are better at imaging the wormhole footprints. The increase in amplitude anomalies appears to be proportional to wormhole density.
Foamy Oil Drive
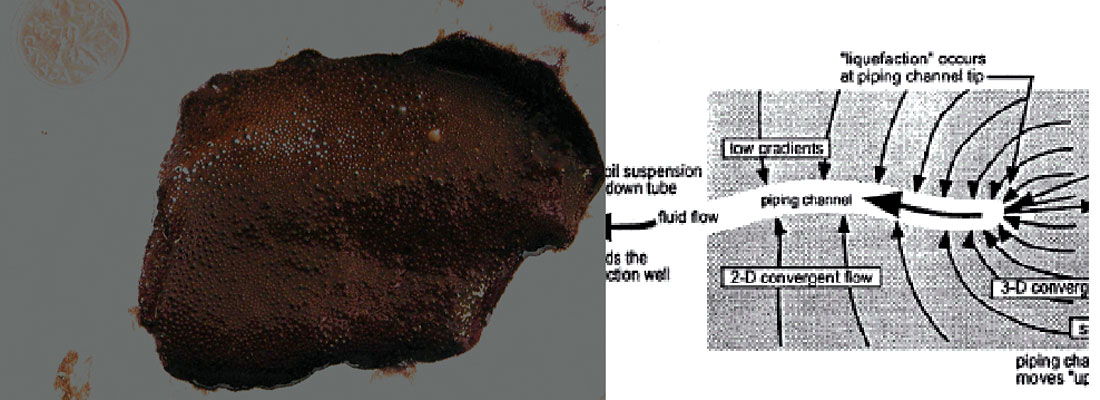
Reservoir depressurization during cold production causes the growth of wormholes. As the pressure falls below the bubble point, the dissolved gases appear as bubbles within the oil. The viscosity and specific gravity of heavy oil restrict the gas bubbles from separating into a single phase resulting in what is known as foamy oil. This process increases the fluid volume within the reservoir, forcing grains apart, and providing pressure to sustain the high production rates (Figure 2).
The presence of small amounts of gas can dramatically decrease the fluid bulk modulus, reducing the P-wave velocity of saturated sands. Elastic moduli and velocities under gas influence, obtained by using the average of Reuss and Voigt bounds, have been applied to an in-situ reservoir in a Western Canadian heavy oil field. 2D numerical seismic responses of foamy oil within drainage areas, show amplitude anomalies and travel time delays when pre- and post-production results are compared. Seismic resolution of anomalous areas is highly dependent on frequency bandwidths.
Geology models and physical property
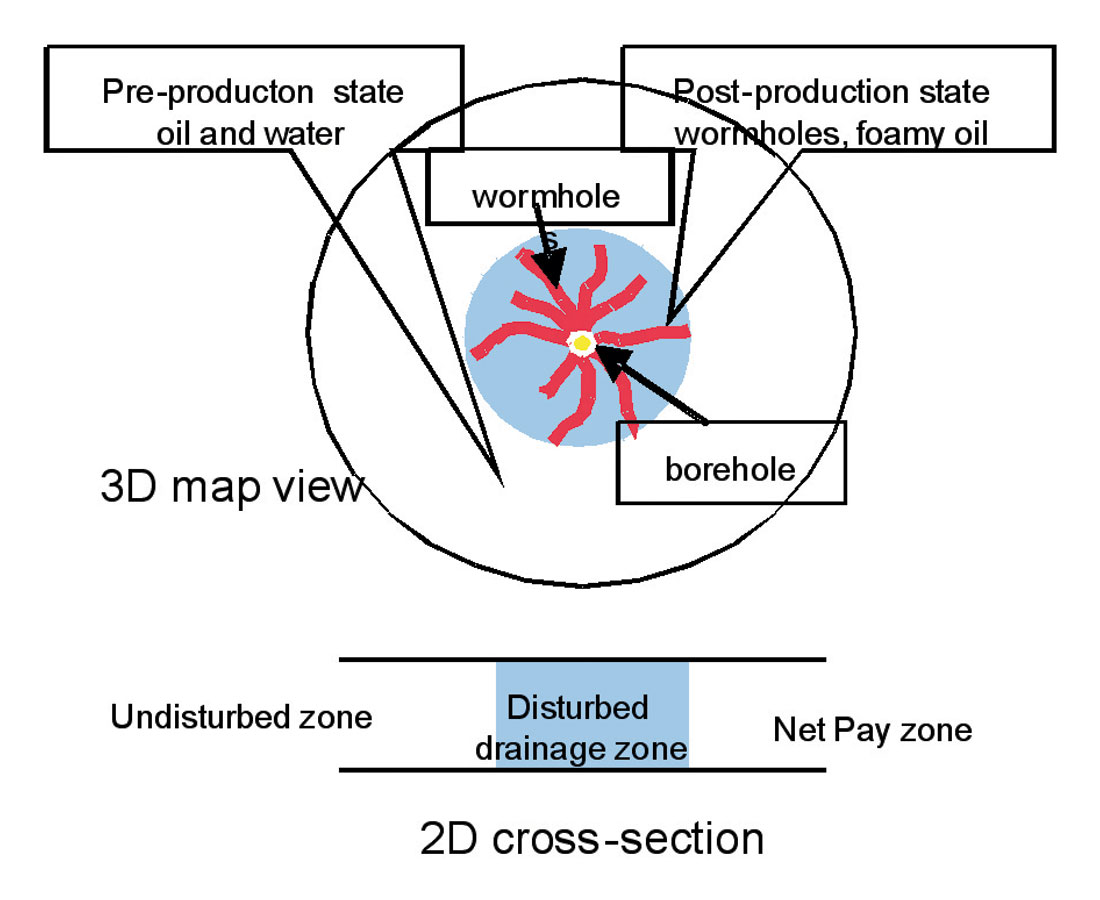
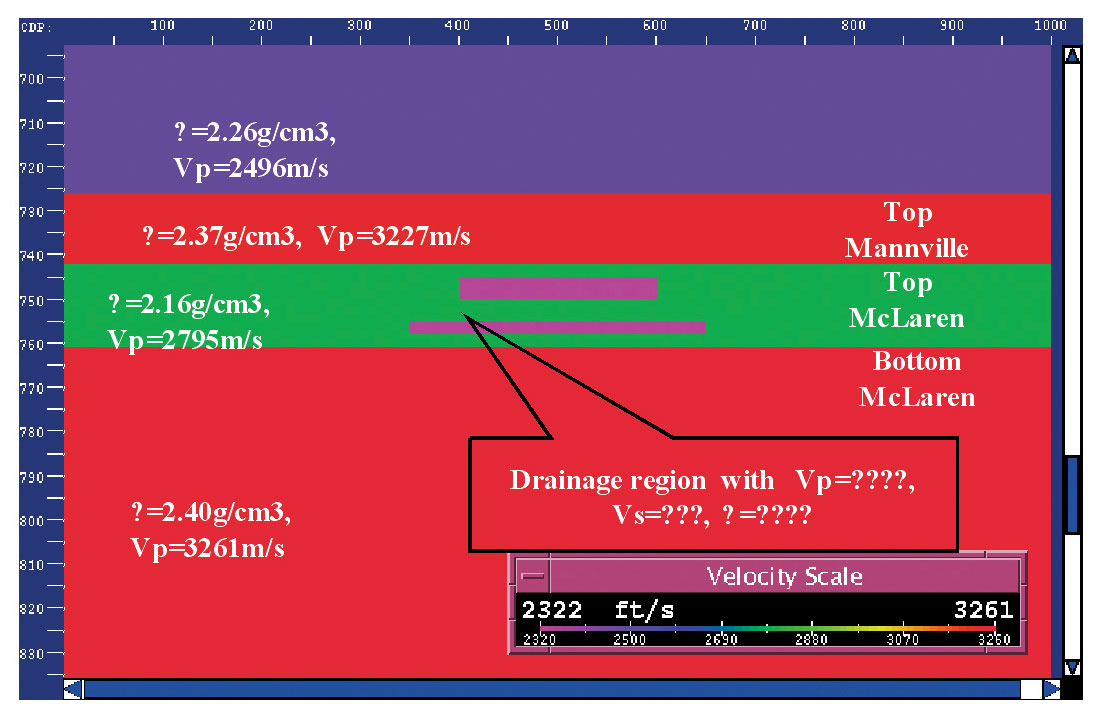
Commencement of cold production disturbs the initial reservoir state through the presence of foamy oil and wormholes, modifying the fluid phase and elastic properties within drainage areas. It is assumed that the drainage zone is a 3D cylinder around boreholes. A schematic of this is shown in Figure 3. The volume of the drainage zone is determined by the length of wormholes and the net pay thickness. 2D numerical models are built based on well logs of the pre-production model in a Canadian cold production field. Figure 4 only shows the post-production model with two drainage zones. They are respectively 5m and 3m thick, and 200m and 300m long.
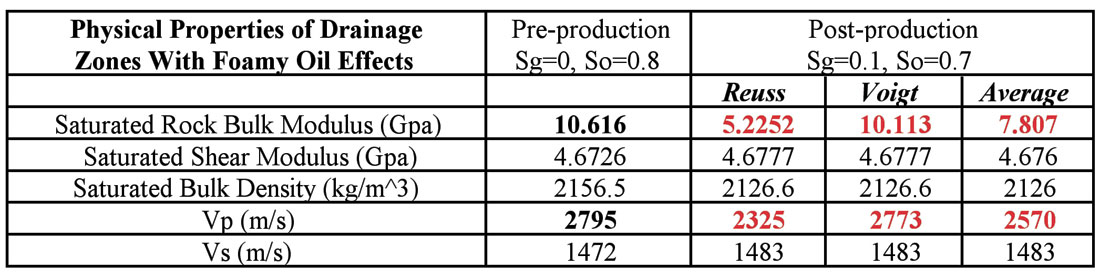
It is necessary that some manner of defining the P-wave, S-wave velocities Vp and Vs and density ρ of the drainage zones be adopted. Foamy oil effects have been computed by applying Reuss lower and Voigt upper bounds, where the moduli for gas, water and heavy oil were calculated from the equations in Batzle and Wang (1992). The results are given in Table 1. With 10% of gas in solution Vp decreases significantly using the lower bound but changes only minimally when the upper bound is used. Slight increases of densities are due to exsolved gas taking the place of heavy oil. As a consequence of the uncertainty in estimating the elastic parameters of fluid mixture, the averages of Vp Vs, and ρ from Reuss and Voigt bounds have been used in the modeling procedure.
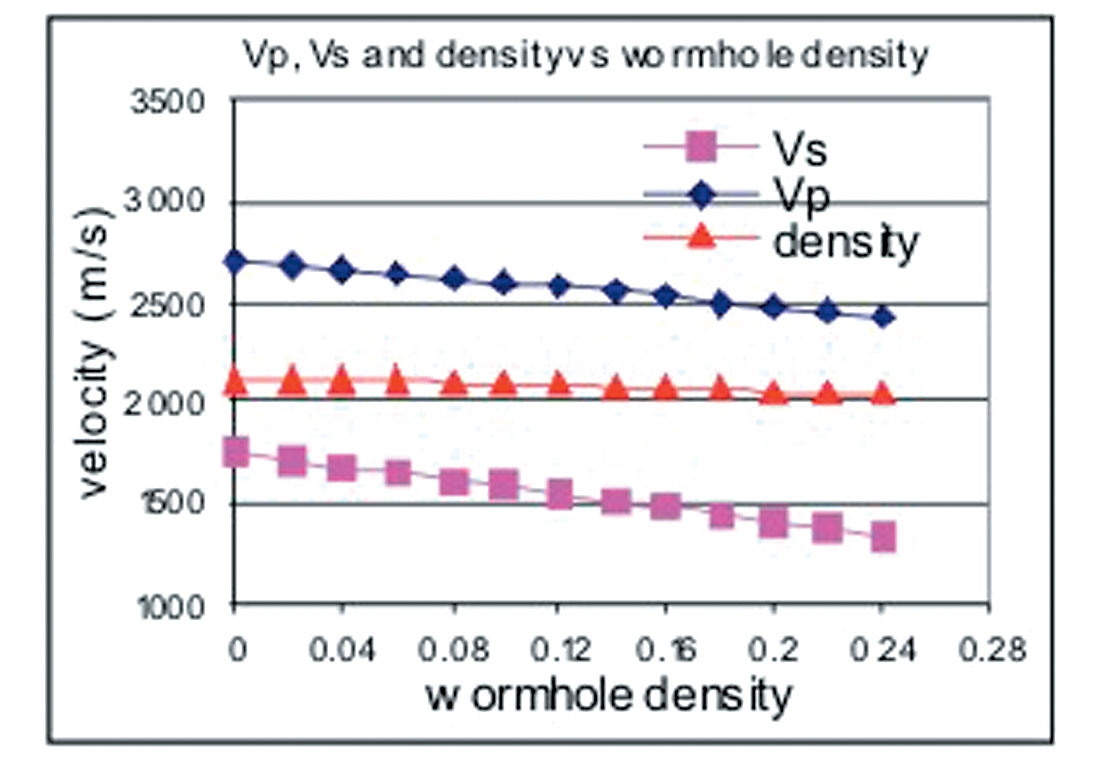
The macroscopic effects of wormholes, ignoring any foamy oil influence, on Vp and Vs within the drainage sands can be observed. These velocities have been obtained by using Voigt upper bound. The reductions of Vp and Vs are proportional to the wormhole density. The decrease in Vs appears more rapid, while ρ changes little (Figure 6).
Modeling results and conclusions
Seismic responses of foamy oil models
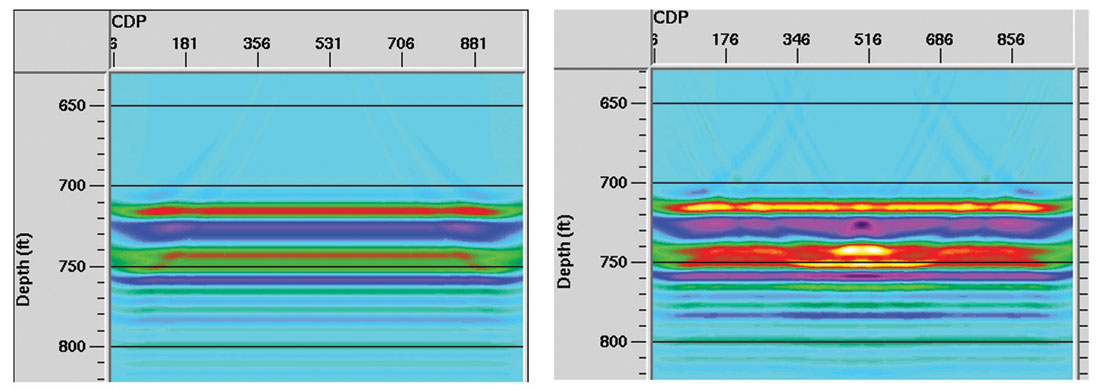
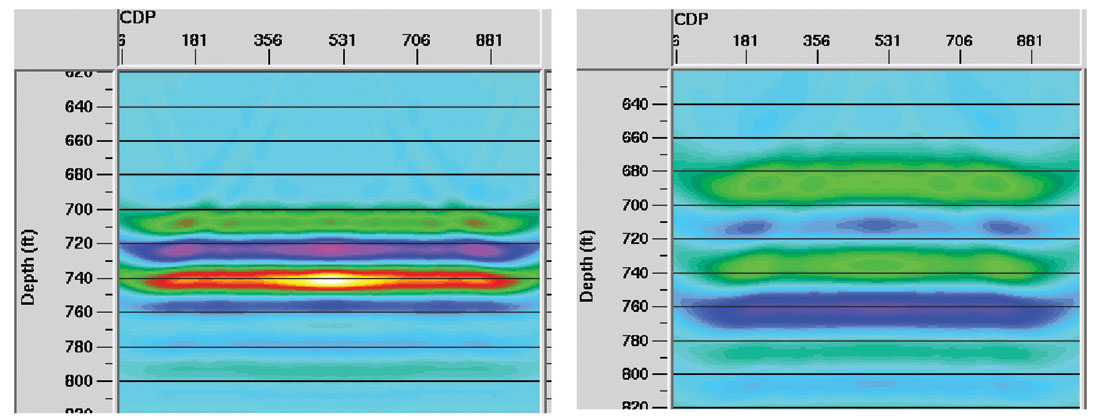
The pre-production model and the two-drainage zone model (shown in Figure 4) have been used to generate zero-offset seismograms, with Vp and ρ taken from Table 1 and using a zero-phase wavelet with frequency bandwidths of 200Hz, 100Hz and 50Hz respectively. Figure 7 shows the depth migrated sections of the pre- and post-production model for a 200Hz frequency bandwidth. The amplitude anomalies and traveltime delays caused by the low velocity drainage zones filled with gas bubbles are evident. At a frequency bandwidth of 100Hz, the cumulative responses of the two drainage zones become one anomaly (Figure 8), rather than the two in Figure 7. With a 50Hz frequency bandwidth any anomalies are difficult to observe (Figure 8).
Seismic Response of Wormhole Models
The post-production model, shown in Figure 4, has been slightly modified including only the upper drainage zone, which has been divided into 10 lateral blocks. A wormhole density increase from 2% to 20% in adjacent blocks is incorporated, corresponding to Vp varying from 2688m/s to 2478m/s and Vs from 1717m/s to 1404m/s. Ray tracing modeling has been employed using a 60Hz Ricker wavelet.
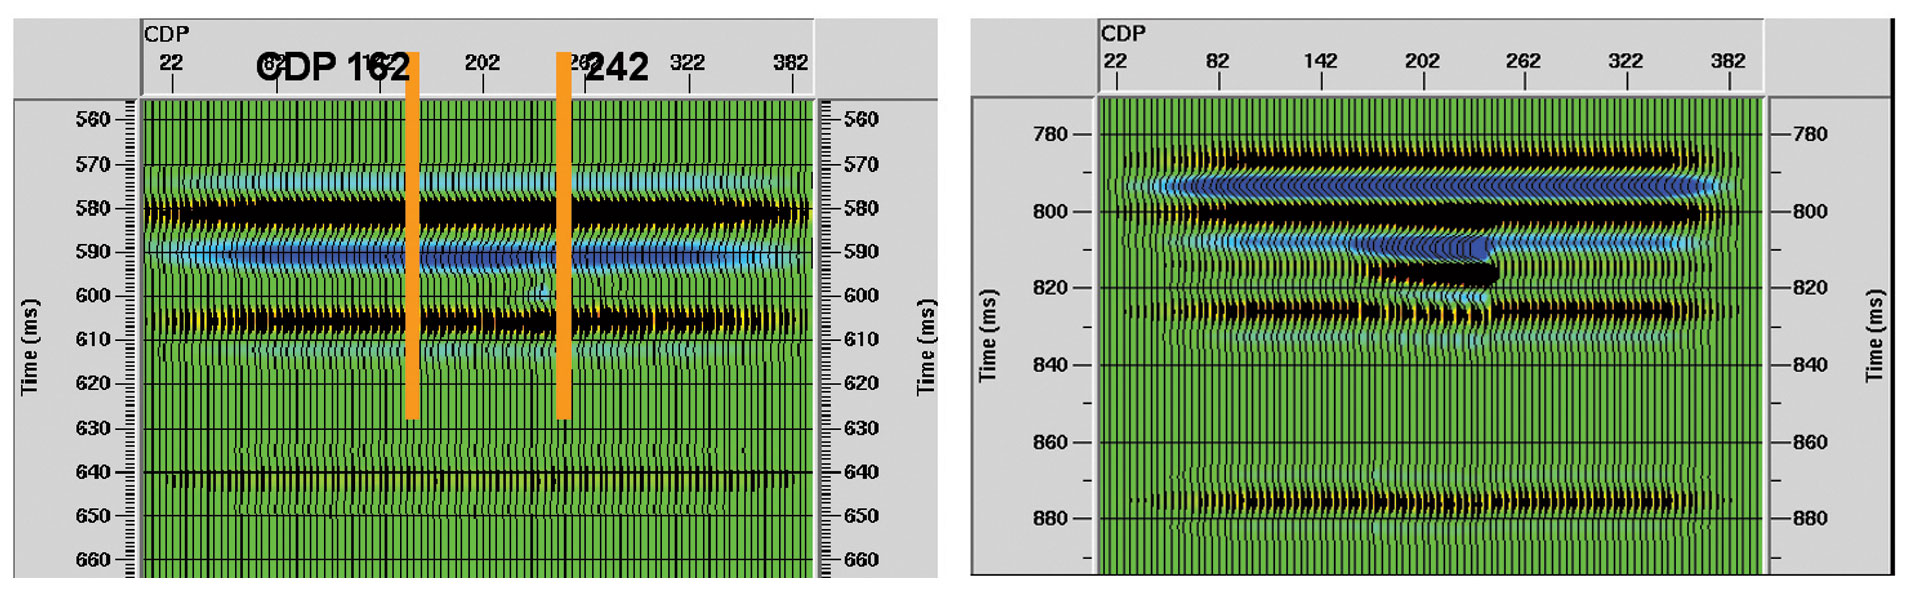
The stacked PP and PS seismic sections are shown in Figure 9. The drainage zone disturbed by wormholes lies between CDP 162 and 242. Because of the greater contrasts in Vs, the amplitude anomalies and travel time delays on the PS section are more readily seen than on the PP section, where only subtle changes can be detected around CDP 240 where high wormhole densities exist. The increases in amplitudes from CDP 162-242 are proportional to the increase of wormhole density, thus possibly predicting the relations between wormhole footprints and amplitude variations. A reason for PS data having higher resolution could be due to its relatively short wavelength compared with that of PP data for similar frequencies.
We may conclude that both PP and PS data could be tools to aid in delineating the footprints of foamy oil and wormholes. PP data is a useful tool imaging foamy oil effects because the fluid changes are sensitive to the P-wave velocity. While the presence of wormholes strongly affects the S-wave velocity, the reflected PS data can also be used to detect the most likely wormhole growing pattern, thus providing possible drainage indicators for infill drilling designs and development plans. As most of cold production reservoirs are thin, high frequencies are required to achieve discernible resolution.

Acknowledgements
The authors thank the Coordination of University Research for Synergy and Effectiveness (COURSE) and Consortium for Research in Elastic Wave Exploration Seismology (CREWES) for their financial and technical support. We acknowledge the contributions to our research made by Alberta Research Council. We also would like to thank Dr. Ron Sawatzky for his valuable suggestions and discussions.


Join the Conversation
Interested in starting, or contributing to a conversation about an article or issue of the RECORDER? Join our CSEG LinkedIn Group.
Share This Article