Introduction
Now, more than ever, the oil and gas industry is in a race to increase productivity. The impact of decisions made today in adopting new technologies and processes will define success in the next decade. Interpreters in today's oil and gas industry are challenged by many factors. Ways to increase productivity are constantly being searched for in an environment where tighter timelines, more technically complex problems, fewer people, and ever increasing volumes of data are realities. Improved productivity can be achieved with today's technology, yet many companies have not realized even a fraction of those gains. The gap between what is possible and what is realized creates a "value gap". Several factors contribute to creating this gap, but the opportunities to close it exist.
As in the past, one of the primary targets for new technological approaches is in 3D seismic interpretation. The sheer volume of data that needs to be accessed, interpreted and stored for further analysis means that even small incremental increases in productivity can lead to easily measurable bottom-line business impact. The prize, however, is actually much larger. New technologies for visualizing, prospecting and interpreting 3D seismic data offer orders of magnitude increases in productivity.
Within the exciting world that these new, innovative tools are creating, it is easy to view sheer speed as the only goal to be pursued. This, however, would clearly be a mistake. Just as p-wave amplitude is only one of the growing arrays of attributes we can analyze in seismic data, shortening the elapsed interpretation time is but one way to positively impact the process of searching for oil and gas. The complexity of the traps that asset teams are trying to describe, combined with the dizzying amount of data these asset teams now have at their disposal, are driving companies to investigate how efficiencies can be gained through different work processes. It is simply not sufficient to depend solely on technology in order to achieve results faster; asset team members also have to work more collaboratively as a group.
As with any technology, the maximum benefit to be derived by the industry as a whole is only proportional to the uptake, or market penetration, if you will, of the technology itself. It is interesting to note that in an environment where significant amounts of resources (both human and fiscal) are dedicated to investigating the issues outlined here, the majority of interpretation still takes place in a traditional surface-focused, line-by-line manner. Any discussion of how technology can facilitate change must also examine the extent to which that technology can become mainstream.
Brief History of Seismic Interpretation
Nowhere has technology acted more clearly as a facilitator in the oil and gas industry than in the domain of 3D seismic interpretation. From the beginning of 3D seismic acquisition in the early 1980s, it was apparent that the status quo as it related to the interpretation processes would not work. Initial technologies for interpreting 3D seismic on computers were developed internally by only the largest companies, utilizing large mainframe computers. In 1982, Landmark Graphics Corporation introduced the 3D seismic workstation. This milestone provided a step-change in our industry: a technology commercially available to a majority of the marketplace. The computing technology was revolutionary; purpose-built, DOS-based workstations on a physical scale smaller than anyone had seen previous. The entire system could be installed in a workroom, and had no special electrical or cooling requirements.
It can be said with confidence that the 3D seismic workstation enabled us to do what we simply could not do before because of time constraints. Beyond the revolutionary nature of the technology though, the basic workflow for interpreting seismic remained unchanged. The data were analyzed (more or less) line by line. Surfaces throughout the seismic volume were interpreted, and through a process of mapping those surfaces, supported by analysis of the relationships between the surfaces, a broad structural framework for the dataset was established. Further techniques allowed interpreters to analyze basic seismic attributes such as amplitude and instantaneous phase and frequency. Again, the key element of the technology was the speed with which the interpretation could be performed.
In the last twenty years, we have seen an unprecedented revolution in computing technology. Much has been written about the increase in computing power that we as a society are witnessing, but none of that makes it any less spectacular to watch. What has it meant in the oil and gas industry though? One could argue that despite the (relatively) staggering computing power available to us in our offices today, the processes around interpreting seismic are, by and large, exactly as the were when we used colored pencils on paper seismic sections -processes are just faster now. Of course, that isn't true. The sophistication of the software supporting exploration and development workflows has grown proportionally with the increase in compute power. In-depth analysis of huge amounts of data is commonplace these days. It is true, however, that the workflow for interpreting 3D seismic has not progressed to the level that computing architecture and network bandwidth could possibly support.
The Seismic World of Today
The concept of visualizing geophysical data in three dimensions is certainly not new. In fact, the argument could easily be made that one of the reasons this technology did not gain widespread acceptance earlier is that geophysicists have been doing this in their heads all along. Most interpretation packages have always had some sort of 'perspective' viewer, which allowed users to view select data types in three dimensions, and visualization packages have been commercially available since the early 1990s. Yet, despite the presence of technology that could hypothetically deliver revolutionary productivity improvements, the status quo remained firmly entrenched. Why was this?
In order for any technology to become mainstream, two criteria must be satisfied. Firstly, there needs to be a problem. There always needs to be incentive to do something different. For the past decade visualization technology offered a solution to a problem that did not apply to everyone. While interpreters were certainly busy, there was perhaps not a universal feeling that the time spent interpreting a 3D seismic survey was the bottleneck in the system. As a result, there were typically a few 'power users' in a company who were the ones who knew how to use the applications. Secondly, in order to become mainstream, technology has to be broadly (some might say universally) available. Until very recently, certainly within the last three years, the ability of mainstream workstations to render 3D graphics and deal dynamically with large datasets was limited. Again, the tendency was for one, or possibly two workstations to be sufficiently configured to run the high-end visualization applications that were available. In the presence of these conditions, and in the absence of the combination of incentive with accessibility, visualization technology remained a niche from which the larger population of interpreters had little knowledge, interest or opportunity to investigate.
Incentive, in the form of some important industry trends, is now becoming more and more compelling. Consider the following statistics, firstly on the demographics of our industry:
- For decades, overall headcount in the E&P business has been declining, and it has not hit bottom yet. During the 1980s, the size of the industry workforce reached an all-time high. Today it stands at less than half that number.
- Meanwhile, the average age of our present workforce is higher than ever before, and still rising. Leading to fears that approximately 60% of the current E&P knowledge workers will begin leaving the industry in 7 years due to retirement.
From a second perspective, the productivity challenges have grown due to the dramatic increases in the volume of data being recorded:
- PGS recently estimated that one of their RANFORM acquisition boats recorded more digital information in one month than had been recorded in written form throughout history from 0-1900 A.D.
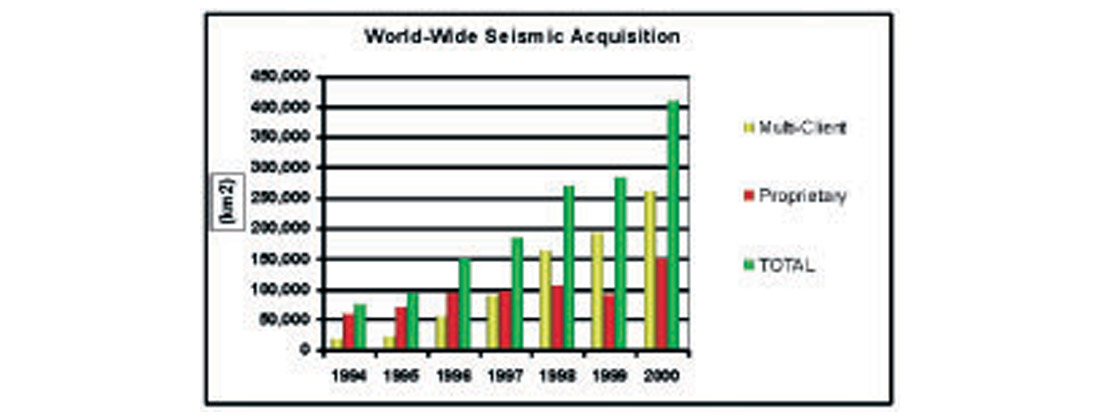
- Figure 1 shows worldwide seismic acquisition for the last eight years. Over that period of time, there has been a five-fold increase in 3D seismic data acquisition. Not only that, but the majority of the data is now multi-client, increasing the need for fast turnaround interpretations.
Beyond the shear volume of data that interpreters are expected to analyze though, there is an accompanying increase in play complexity. Whether the target is offshore, in the foothills or a subtle stratigraphic play in Western Canada, the plays are becoming more difficult to define.
From the interpreter's perspective, seismic data volumes are too large to analyze using traditional methods alone. Structural plays are too subtle and complex to properly describe using surface-based interpretation exclusively. The amount of attribute data being used to describe lithology and predict fluid properties is too large to be represented without powerful visual assistance. In short, there is too much work to do, and not enough time in which to do it.
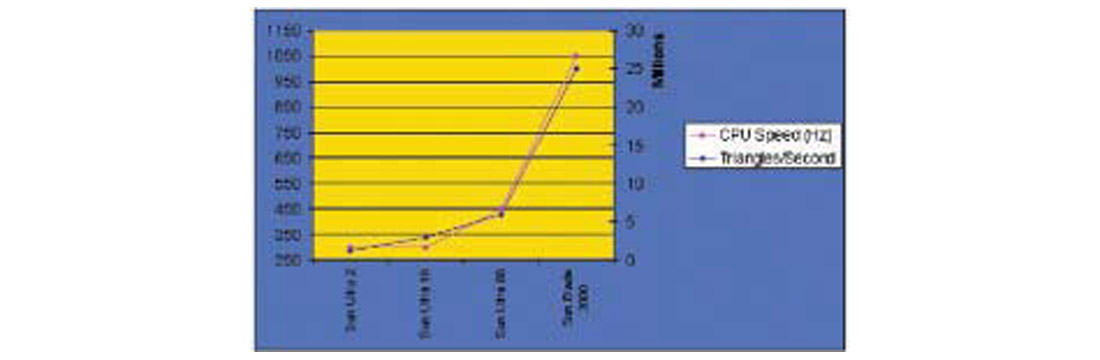
In spite of what has just been stated, accessibility is no longer an issue; Figure 2 shows the progression of computing technology that we have become comfortable with in the interpretive domain. In the past 5 years, the industry has seen a four-fold increase in CPU speed, and an eight-fold increase in graphics rendering speed on our desktop systems. The increasing capabilities of desktop workstations, combined with the proliferation of high-end visualization environments in the industry, have created a situation where the average interpreter now has more or less unrestricted access to tools for 3D visualization and volume interpretation.
Seismic Interpretation Tools and Technologies
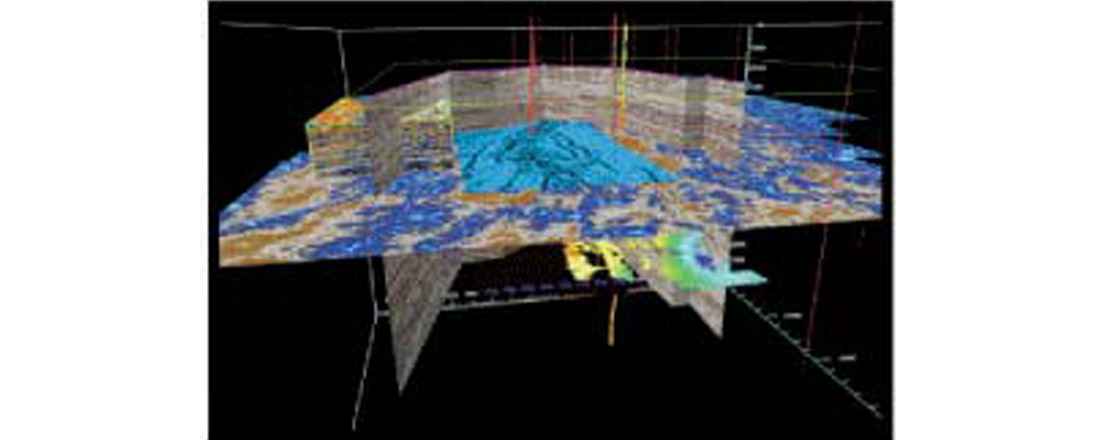
Perhaps the best place to start when looking at the tools available is Magic Earth's GeoProbe™ (Figure 3), which represents the state of the art in geophysical visualization and interpretation technology. GeoProbe was designed to virtually eliminate latency — the time between manipulating the image and it being refreshed on the screen — and allow users to follow their thoughts as they navigate through multiple seismic cubes on a scale previously not possible. In order to achieve the speed necessary to accomplish this, GeoProbe was designed and built to take advantage of the capabilities of Silicon Graphics computing architecture. SGI's unsurpassed abilities to render large volumes of data, combined with the multi-threaded design and 64-bit architecture of GeoProbe have revolutionized the process of initial prospecting and interpretation of super large 3D surveys.
It is certainly clear that the ability to visualize vast amounts of data in a manner unconstrained by computers or traditional interpretation techniques offers the potential of noteworthy cycle time reductions, as well as an increase in identifying higher quality prospects. Being able to visualize and interpret seismic data in new ways that recognize these potential prospects are, after all, a volume of data and not a sequence of 2D slices, and hold the key to unlocking the full potential of 3D seismic data. The only problem with this scenario is that the focus purely on innovation — an obvious necessity when trying to create step changes in the industry — tends to lead to technology that is somewhat isolated from the mainstream of interpretive tools. It bears repeating that accessibility is as important as incentive when trying to solve problems. Therefore, tools that are isolated, either in data environment, or computing architecture, will not deliver the maximum potential impact they can offer. On the surface, this may seem like an unsolvable dilemma; innovation removes a tool from the hands of those who need it. In reality it is not that simple. We are fast approaching a time when one or more high-end graphics super computers are seen as a necessary part of a company's technology portfolio, often in support of visualization facilities. Additionally, seamless data transfer mechanisms supporting common data types are part of GeoProbe's core functionality. To the extent that this revolutionary technology can be, it is integrated with the user's environment.
While tools such as GeoProbe continue to optimize connectivity to the user's everyday toolset, they are being supported by applications such as Landmark's EarthCube. EarthCube is a tool that facilitates visualization and volume interpretation in a seamless extension of every users common interpretive environment. This type of tool has a critical role in the introduction of visualization technologies simply because its availability facilitates adoption. Furthermore, that adoption can lead to significant and measurable bottom line results. The most important thing to note here is the notion of desktop availability. Because tools like EarthCube are developed to operate across several computing architectures, it is very easy to overlook that fact that successful use of visualization technologies is still highly dependant on high-end graphics cards with as much memory available as possible. As this technology continues to become a more mainstream and necessary part of the interpreters toolset, supporting this technology by putting appropriately configured systems in the users hands will become more and more important.
Beyond Seismic Interpretation
A significant benefit of visualization technology in general is its ability to facilitate communication. Views about some aspect of interpreting complex subsurface features are often difficult to express unambiguously. Those same concepts, when displayed either on screen, or in a visualization center, become clear to all involved. Furthermore, when interpretive data from the geophysicist's domain is displayed in spatial relationship to the interpretations of the other asset team members, it becomes the basis for a much more efficient relationship amongst the team members. For that reason, no discussion regarding visualization technology is complete without examining how this technology can facilitate more effective inter-disciplinary collaboration amongst co-workers.
Landmark's OpenVision is a natural extension into the mainstream of E&D asset teams of visualization technology beyond its initial birthplace in the geophysical domain. These tools are designed to give graphical life to the concept of the shared earth model. Through visualization technologies, asset teams are now able to view the status of their collective understanding of the subsurface at any time. As the team iterates through the interpretive process, adding more interpretive data and new disciplines as they proceed, this is presented through the tools. Effective communication, through individual use of the tools at the desktop or group sessions in a visualization center, ensures that all team members understand thoroughly each team members' interpretations and how their own interpretation contributes to the earth model. The environment also supports specific collaborative tasks, such as well planning.
The Future
It would be easy to assume from all of the attention being spent on visualization technologies in general, and volume interpretation in particular, that the end is near for line-by-line interpretations. Clearly, nothing could be further from the truth. There will always be a need to generate a complete structural framework in areas where oil and gas prospects exist. What these new technologies can offer us is the ability to much more quickly decide exactly where and when? that complete framework is required. Technologies that allow us to look at the 3D data set as a volume, focus in on particular amplitude ranges in that volume, and interpret the data as volumes are now available, and offer a step change in productivity. The advances in computing technology are only ensuring that these new tools are no longer to be considered 'niche' or even optional.
As these innovative tools continue to make us more productive, we will see their applicability across all E&D work processes continue to expand. Just as the asset team benefits from collaboration, that collaboration should rightly continue to grow across organizations. It would be a mistake to view visualization as a technology that is only applicable to G&G workflows. Oil and gas companies are continuing to investigate how to properly integrate the surface facilities planning to subsurface interpretation, and how to properly quantify risk and assign appropriate resources where the risk is most impacting the overall economics of an asset. These are just two examples of where visualization technologies will continue to bring revolutionary change to our industry.


Join the Conversation
Interested in starting, or contributing to a conversation about an article or issue of the RECORDER? Join our CSEG LinkedIn Group.
Share This Article