Industrial Trends
The current world oil supply and demand models are indicating a trend towards future higher prices and long-term shortages. The world’s growing dependence on oil, which may face shortages in supply, is a serious long-term challenge. The economic security of the industrial nations is closely tied to global oil market developments. Without major improvements in the current subsurface seismic imaging and oil extraction technologies, the world oil and gas supply will not be able to satisfy the future energy demands. It is imperative that the declining trend of the output from the existing fields is stopped and new reserves are continuously added to satisfy the growing needs of the world economy. The evolutionary improvements in current technologies (3-D seismic, Multi-component recording, down-hole seismic, etc.), which have been in the market for over twenty years, may not be able to help in producing 10 to 15% additional reserves from the existing fields. A radically new concept - a paradigm shift - may have to be introduced to provide the future impetus.
Elastic Nonlinear Seismic
In a nonlinear elastic system, the principle of superposition does not hold and the frequency mixing, harmonic generation, and spectral broadening takes place. These changes that add new frequencies to the frequency spectrum provide us with a means of measuring the elastic nonlinearity parameter of the reservoir rocks. This elastic nonlinearity parameter is unique, and can be effectively used as a seismic attribute to map the rock properties of the reservoirs for improving the results of the exploration and exploitation efforts. The sensitivity of the nonlinear response to the porosity, fracturing, and pore fluids of the reservoir rocks is relatively larger than the linear measurements being used today. Industry needs to take advantage of this additional seismic attribute to reduce the ambiguity of the seismic-based geologic interpretation.
Other industries have used the nonlinearity of a propagating medium to overcome some of their previous limitations and have successfully developed new products and applications. Westervelt (1963) used nonlinearity of water for creating a low frequency beam from two high-frequency collinear waves by using their interaction in a nonlinear medium for submarine detection. More recently, Pompei (MIT) used nonlinearity of the air to create audio spotlight using inter-modulation of ultrasound beams in the air.
Sedimentary rocks compared to air or water are highly heterogeneous, especially reservoir rocks, which are porous, fractured, and fluid-saturated. Their micro-structural complexity and heterogeneity makes them highly nonlinear compared to homogeneous mediums. The relative sensitivity of nonlinear response of the reservoir properties is far larger than the linear measurements of velocity and attenuation. Due to their higher differential sensitivity, the measurement of the nonlinearity parameter of the reservoir rock can be effectively used for mapping reservoir properties and providing more reliable seismic imaging results.
The author proposes that new reservoir characterization methods should be developed by using the elastic nonlinearity parameters of the reservoir rocks and their correlation with the reservoir properties. Seismic wave propagation through fractured or porous and permeable rocks generates new frequencies not originally present in the input signal. Seismic images created using the newly generated frequencies provide unique information related to reservoir properties at very little additional cost to the oil company. Nonlinear seismic imaging enables the end-user to retain the conventional linear seismic images and provides additional nonlinear seismic images that identify the porous and fractured reservoir rocks. In areas where the current seismic fails to map the stratigraphic or fractured hydrocarbon traps, nonlinear seismic technology can provide the useful reservoir information. Carbonate reservoirs are a prime target for this technology, since their porosity and permeability quite often does not correlate with the structure or the linear measurements of velocity and attenuation.
Applications of Nonlinear Seismic Technology
1) Imaging Reservoir Porosity: Measurement of porosity is the most important factor affecting the quality of a hydrocarbon reservoir because it determines the maximum volume available for oil and gas accumulation. Hydrocarbon traps or reservoirs are formed when non-permeable formations provide a seal against a porous and permeable reservoir formation. Hydrocarbon traps are formed in many different ways. The structural traps are formed due to folding and tectonics that create anticlines and closures against the faults, etc. Such structural traps, due to their simple physical geometry, are relatively easier to map using current seismic methods. On the other hand, stratigraphic traps are formed when a reservoir formation is sealed by changes in lithology or rock type during deposition or post-deposition. The physical geometry of such traps is not readily obvious. Stratigraphic traps are geologically m o re complex because they are caused by unconformities, channels, and sand bars, due to secondary porosity created by fracturing or bleaching of the cementation between grains. Stratigraphic traps are more difficult to map using the current reflection seismic methods that measure travel times and signal amplitudes, and derive other parameters from that information. There is a high degree of probability that a considerable amount of hydrocarbons have been left undiscovered in geologically complex reservoirs that cannot be mapped using existing seismic methods.
Irrespective of the physical geometry of the deposition or the changes caused by tectonics after deposition, there will not be any large amounts of hydrocarbons in a reservoir unless there is a substantial amount of rock volume that exhibits porosity. Mapping porosity is the most important part of hydrocarbon exploration.
The porous reservoir rocks contain a variety of mesoscopic structural features (cracks, voids, joints, grain contacts) with different elastic properties that are specific to their structure. The voids and cracks are filled with multiphase fluids, which are under pressure. The fluid pressure couples to the mechanical effects of an externally applied stress or strain. Most fluids exhibit viscosity and behave differently during load and unload cycles. The cementation between the grains can also exhibit plastic properties. The result is a complex configuration of tiny springs connected to each other in series and parallel combination, each one of them behaving nonlinearly. Research work on dynamic nonlinearity of rocks carried out in the Los Alamos Laboratories and Stevens Institute of Technology establishes a relationship between the measurable nonlinear parameters and the physical characteristics of the porous rocks, and establishes that the elastic nonlinearity of the rocks directly relates with effective porosity.
Due to the dependence of nonlinear parameters on rock porosity, seismic nonlinearity measurements can be used to map the in situ porosity of the reservoir rocks. When a compressional seismic signal of a discrete frequency propagates through a nonlinear rock, its harmonics are generated in addition to the primary frequency. If there are more than one discrete frequency that constitute the signal, then in addition to their harmonics the sum and difference of the frequencies are also generated during the propagation through a nonlinear medium. For most practical purposes, the nonlinearity parameter directly correlates with the ratio of the amplitude of the harmonics generated or the sum and difference frequencies generated, to the amplitude of the fundamental first harmonic signal.
The current state-of-the-art seismic technologies that are being used to map the reservoir characteristics include 3-D seismic reflection surveys, seismic attribute analysis, signal amplitude extraction, and coherency techniques. The current seismic imaging methods provide results that are quite often non-unique and ambiguous and fail to identify the higher porosity and fractured zones that may be the potential target for increasing future hydrocarbon reserves.
The Nonlinear Seismic method to map porosity uses the measurement of the summed and differenced frequencies created due to the interaction of the two seismic (waves) or signals as they propagate through the porous and heterogeneous reservoir rocks. One of the signals is a vibratory 'sweep' commonly used for seismic recording; the frequency is swept over the seismic band from low to high or high to low over a period of several seconds. The concept is well known in the industry and is the current art. The second signal is a mono-frequency sinusoidal signal, which has the same time duration as the vibratory sweep. Both the seismic signals or waves are generated, and transmitted using standard vibratory sources from a single source array that behave as a single surface source location. The combined seismic wave is used for seismic reflection recording. It propagates through the surface formations and is transmitted and reflected at the formation boundaries that provide acoustic impedance contrasts. The reflected seismic signals are recorded using multiple detector arrays located on the surface or in different wellbores or both. The recording procedures are well known and commonly practiced by the industry. In this Nonlinear Seismic method, the interaction of the two seismic waves as they propagate through the reservoir rocks is measured to map their nonlinear characteristics that correspond to the rock’s bulk porosity, heterogeneity, and fluid content. The data, which are recorded, have two different sets of information. The cross-correlation with the standard 'sweep' provides the normal data-set used for normal reflection processing similar to current 2-D and 3-D seismic processing that is universally practiced and known in the industry.
The second set of information is extracted by generating two new sweep signals. These new signals are generated by adding and differencing the mono-frequency with the 'sweep' frequencies, thus creating two 'modified-sweeps.' Cross-correlating the recorded data with these 'modified-sweeps' provides the data that corresponds to the elastic nonlinearity of the rocks. This new set of data, which results after cross-correlation with the two 'modified-sweeps' and contains newly generated frequencies, represents the result of interaction between the mono-frequency wave and the 'sweep' frequency wave as they propagate through the nonlinear reservoir rocks. The processing parameters for this new data set are similar to the parameters used for the data generated after cross-correlation with the primary 'sweep' signal. A conventional 2-D and 3-D seismic processing sequence can be used for both sets of data to provide the reflection seismic image of the subsurface. The integration and interpretation of the two results, one based on the primary sweep, and the other based on the two modified-sweeps, highlights and identifies the subsurface formations that are nonlinear due to porosity, microfractures, and fluid saturation. The results based on the two 'modified-sweeps' display the reflected signals from higher porosity and micro-fractured formations at relatively higher amplitudes compared to the reflections from homogeneous and non-porous formations. The unique contribution of the Nonlinear Seismic is that it provides a method of differential illumination of the subsurface formations that are of greater interest to the hydrocarbon producers. Clays and shales are normally less porous, more homogeneous, and behave more linearly in comparison with high porosity sandstones and limestones. As a result, shales and clays generate a weaker 'interaction' signal and show less prominent amplitude response on the nonlinearity seismic section. Integration and interpretation of the processed reflection seismic results, based on the three sets of data, provide new and valuable information related to the reservoir and potential hydrocarbon accumulations.
2) Imaging Reservoir Fractures: Hydrocarbons in fractured rocks provide a growing target for future reserves. Fractured low-permeability reservoirs are common throughout the world and are prime targets for future hydrocarbon exploration. Fractures are formed when the rocks are deformed beyond their elastic limits. In the case of open fractures, it is unlikely that elastic healing of the fractured rock has taken place to make it elastically linear. Due to high nonlinearity of the reservoir fractured rocks, measurement of nonlinearity characteristics can be effectively used to map their location and orientation.
Additionally, determining the exact location of fractures and faults is becoming increasingly important in reservoirs where water invasion is becoming a problem. Some of the prolific carbonate reservoirs in the world are showing signs of increased water production and unpredictable water flooding. In cases like these, which are common worldwide, it is important to know the exact location and orientation of the fractures, joints, and faults to maximize oil recovery with the lowest cost.
Horizontal drilling is becoming more popular since the horizontal wellbore intersects more of the producing reservoir rock. To take full advantage of this capability, correct decisions have to be made for selecting the formations, directions, and lengths of the wellbore to optimize costs and production. These decisions can only be made if the location and orientation of the fractures are accurately mapped.
Since fractured rocks exhibit strong elastic nonlinearity at right angles to the fractures, and little or no nonlinearity along the fractures, this behavior can be utilized for mapping fractured reservoirs using three dimensional (3-D) seismic, which offers 360 degree distribution of source-receiver azimuthal angles. Compressional vibratory seismic sources, transmitting two collimated seismic waves, are used for recording a normal 3-D data set. This data set is recorded with field parameters so that it will provide a means of measuring nonlinear effects related to different azimuthal angles, thus mapping the location and the orientation of the fractures.
The nonlinear elastic interaction between the two transmitted signals, resulting in the sum and difference of the two transmitted frequencies, is processed to display different source-receiver azimuthal angles to map the location and orientation of the fractures. The seismic image created using sum and difference of the transmitted swept frequencies of the two compressional waves, mentioned above, will be zero when the modulation source and the carrier source are located parallel to the fractures or directly above them. The interaction will also be zero when the sources and the receivers are located on the surface in such a manner that the recorded reflected signal does not intersect with any subsurface open fractures. The image representing the fractures will only be present when the source receiver azimuthal angle is at or near right angles to the fractures. By recording 3-D seismic data using a normal swept frequency signal and a mono-frequency signal, three seismic images are created. One seismic image is the standard image, which is conventionally used today. The other two images are created by cross-correlation with the sum and difference frequencies of the swept frequency and the mono-frequency. The two sum and difference frequency images will map the fractures at higher amplitudes compared to nonfractured formations. The seismic image re p resenting the azimuthal distribution of the seismic signal wave path at right angles to the fractures will have the highest amplitude. The seismic signal arriving parallel to the fractures or directly above them will give no distinct image. In this manner, the results of the nonlinear interaction between the two transmitted waves is used to determine the location and orientation of the fractures.
In marine seismic, where an impulse energy source is used, the nonlinearity of the fractures will broaden the transmitted spectrum. Additional lower and higher frequencies not present in the source-generated seismic impulse will be created. Due to earth filtering, higher frequencies may get attenuated but the lower frequencies generated due to nonlinearity of the fractures will be prominent in the seismic data that is recorded at or near right angles to the fracture orientation. The lower frequency seismic image, displayed using different source-receiver azimuthal angles, will map the fracture location and orientation.
3) Mapping Pore Fluids: In many of the producing fields, hydrocarbons have been left behind because the industry lacks a technology that will identify the trapped and un-produced hydrocarbons due to the complex geology of the reservoirs. At present the hydrocarbon extraction technologies, in the form of horizontal and multilateral drilling and intelligent well completions, exist. What is lacking is a reliable sub-surface imaging method with the required resolution to map the reservoir characteristics, the reservoir fluids, and their movement. A seismic technology that will provide reliable information regarding the changes caused by the field production in the petrophysical properties of the reservoir rocks and its pore fluids, will be economically very beneficial.
Over a period of time, due to hydrocarbon production from a reservoir, there are changes in the pressure distribution, oil-water contact, gas/oil ratio, temperature, etc. Seismic sensitivity to these changes that occur due to production and injection, can be used for nonlinear time-lapse seismic, to monitor the bypassed oil, map fluid flow barriers, fluid saturation changes, and for mapping the fluid fronts. The changes in the internal fluid parameters of the reservoir rocks due to fluid movement affect the propagation characteristics of the seismic wave as it travels through the reservoir at different time intervals during a production or injection phase. Since the propagation of seismic wave is a coupled motion between rock matrix and pore fluids, its propagation characteristics change according to the changes of the internal parameters in the reservoir. The changes in the viscosity of the reservoir pore fluids make a major contribution in the elastically nonlinear seismic response of the time-lapse seismic recording.
Viscosity is an important physical property of the reservoir fluids that differentiates them from each other. For instance, the viscosity of oil is 50 times higher than the viscosity of gas. The viscosity of the pore fluid plays an important part in a fluid-saturated solid’s oscillatory motion due to viscous friction and inertial coupling. The type of fluid and its viscosity in the pore space and at the grain contacts has a large influence on the elastic properties of the rock. Due to the pore fluid viscosity, hysteresis is observed in the stress-strain relationship of a reservoir rock when exposed to an oscillatory seismic wave.
Hysteresis is a property of viscoelastic materials and is strongly associated with the pore fluid motion. Hysteresis represents the history dependence of physical systems (If we push on something, it yields; but when we release, if it does not come back completely than it is exhibiting hysteresis). So, if there is a difference in the stress/strain relationship between loading and unloading cycles of a rock than it can be categorized as hysteretic. The area of the stress/strain hysteresis loop represents energy dissipation as heat during the load cycle. This heat conversion is a nonlinear and partially non-reversible process. When a sinusoidal seismic wave propagates through the reservoir rock, the load is reversed from the compression to the rarefaction cycle of the seismic wave, causing a lag between stress and strain, determining the size of the hysteresis loop. This phenomenon is dominated by the properties of the pore fluids. Time lag is fluid dependent; long chain fluid molecules give rise to higher time lags. Higher hysteresis at seismic frequencies is related to the higher viscosity of the pore fluids. Oil that has higher viscosity compared to water will display a more pronounced hysteretic behavior to an oscillatory seismic wave, compared to water or natural gas that has lower viscosity. Since the nonlinear hysteretic behavior of the saturated reservoir rock generates harmonics of the primary signal, the measurement of these harmonics can be used as a diagnostic tool for determining the fluid saturation and the type of pore fluids.
The characteristic of the second and other even harmonics is that the primary signal waveform during compression and rarefaction cycles is not identical. So the presence of the even harmonics is indicative that the compression cycle of a sinusoidal seismic wave is different from the rarefaction cycle (there may even be a discontinuity during unload cycle). The fluid-saturated reservoir rock behaves differently when it is compressed compared to when the compression is removed. The third harmonic, on the other hand, is generated when the distortion during compression and rare faction cycles of the sinusoidal seismic wave is symmetrical. This in turn is indicative that the viscosity of the pore fluids is such that the rock is exhibiting less hysteresis – pore fluids have lower viscosity. Note that these harmonics in consideration are not generated by the seismic source, but are generated in the earth during the seismic signal propagation through the nonlinear rocks of the reservoir.
Due to the complex nature of the rock composition, we may expect both odd and even harmonics generated when a seismic wave travels through an elastically nonlinear reservoir rock. But, the amplitude of the even harmonics will be greater and will dominate when the pore fluids have higher viscosity like oil. The amplitude of the odd harmonics will be more pronounced when we have lower viscosity pore fluids like water. The measurements of the relative amplitudes of the odd and even harmonics of a primary seismic wave (signal) and the differences in their relative amplitudes over time will indicate the changes and the movement of the pore fluids caused due to hydrocarbon production.
When the seismic reflection data are recorded using a vibratory source that transmits a swept frequency signal, the cross- correlation with the transmitted signal provides a primary data set that is free from the harmonics generated by the nonlinearity of the earth. This represents the standard and conventional seismic reflection image being used today in the industry. However, when the same data-set is cross- correlated with different harmonics of the swept frequencies, the result of the cross- correlation is the reflected image of the subsurface which is illuminated with each particular harmonic. Harmonics of the primary swept frequency signal are generated only during the propagation of the primary signal through the reservoir, which is nonlinear due to its porosity and its pore fluids. For this reason, the reflected image created by each harmonic displays only the reservoir and its pore fluids. The formations, which consist of non-porous rocks and do not have any pore fluids, will not be visible and will appear as a non-coherent signal on the nonlinear seismic reflection image.
The seismic reflection image generated by the result of cross-correlation with the second harmonic will represent the part of the reservoir that is porous and has higher viscosity pore fluids. In the same manner, the result of the cross- correlation with the third harmonic will illuminate the part of the reservoir that is saturated with the lower viscosity fluids. Any changes in the relative amplitudes of the odd or even harmonics in time-lapse recording will relate to the changes in the reservoir pore fluids that have taken place due to hydrocarbon production. By mapping and displaying the subsurface seismic reflection image of the reservoir generated by each of the odd and even harmonics and monitoring the changes in their relative amplitudes over time, the movement of the reservoir fluids can be mapped.
Time-lapse seismic, which is also known as 4-D, has a great deal of potential as a reservoir surveillance tool. 4-D can enable one to monitor the changes over time due to fluid movement during hydrocarbon production. It provides an analysis of the hydrocarbon sweep efficiency and can act as a guideline for better reservoir management throughout the life of the reservoir. When using current seismic imaging methods, the time-lapse seismic response quite often is non-unique, since the changes in reflection amplitude and its character can be caused due to various factors. The same seismic response can be caused due to changes in oil saturation, gas-to-oil ratio, pressure variation, temperature changes, etc. Reservoir seismic response has many variables, and at present, there are not enough seismic attributes to solve them. To characterize reservoir properties with a higher level of confidence, more seismic attributes in addition to amplitude, attenuation, and velocity are needed. Nonlinear time-lapse seismic integrated with the current imaging technology will overcome the weaknesses that exist due to ambiguity of the results.
To overcome the shortcomings of compressional wave (p-wave) recording, a great deal of effort by different oil and service companies was made to incorporate p-wave seismic information with shear wave (S-wave) seismic information. The integration of the p-wave and S-wave information potentially could improve the estimation of reservoir properties and assist in monitoring the changes in the reservoir fluids caused by production processes. Unfortunately, the problems of using S-wave land surface sources were insurmountable, and it was not possible to generate S-waves in a marine environment. These problems led to a compromise of using mode converted shear waves using a p-wave source and multi-component sensors. Using mode converted shear waves provide complexity and ambiguity in data processing and its final results. It is a compromise rather than a solution.
Field Test Results
An Example of Crosswell Seismic Data Showing Direct Relationship between Porosity, Pore Fluids and Nonlinearity
Figure 1 is an example showing a part of the crosswell seismic data that were recorded with a seismic downhole source in one well and the seismic downhole receivers in the other well. This display represents the frequency spectrum of the received signals in the receiver well. The distance between the two wells is 990 feet. The subsurface formations were deposited in stable geologic conditions. The dip of the formations based on the well logs is about 1 degree. The depths of the downhole source and downhole receiver during the recordings were maintained so that both the source and receiver were in the same subsurface geologic formation. The source transmitted a mono-frequency signal of 1,000 Hz. The crosswell test was repeated using two frequencies data were recorded at 10-ft. depth intervals. The recorded data were analyzed using Fast Fourier Transform (FFT).
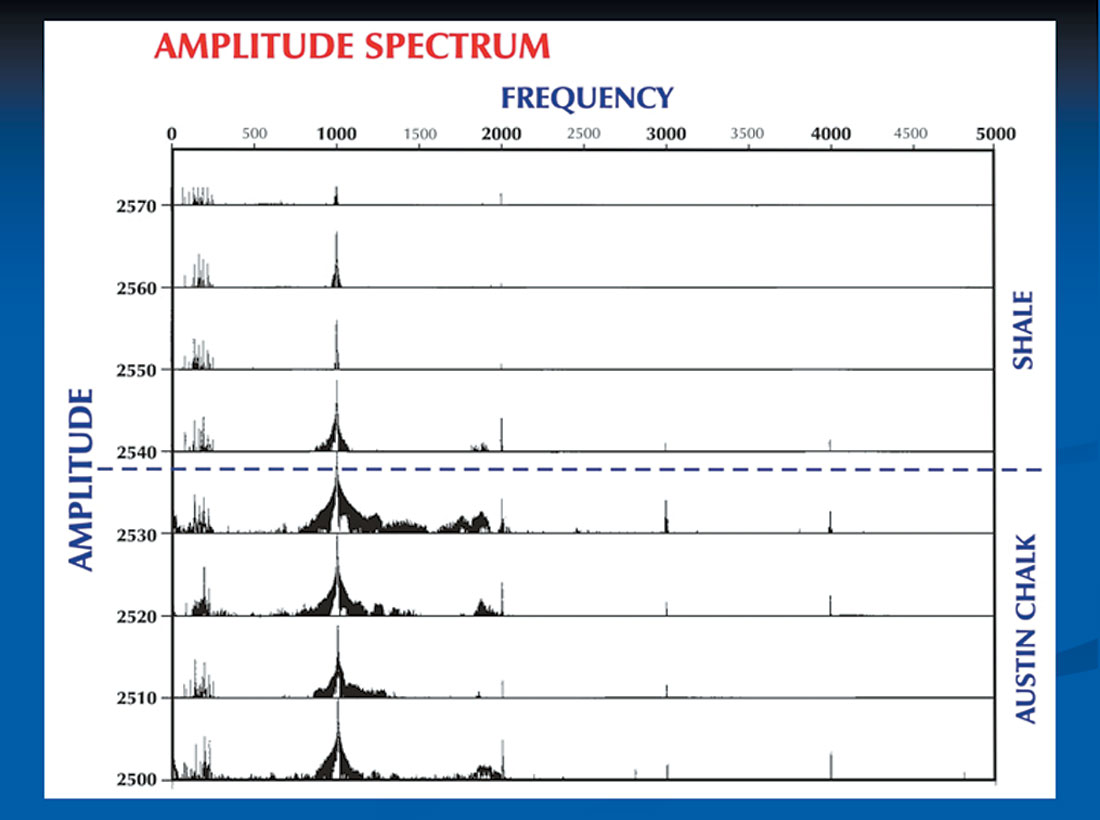
The frequency spectrum of the crosswell data, which were recorded using 1,000 Hz frequency transmitted by the source, indicates that there is higher elastic nonlinearity in the lower 30 feet of the Austin Chalk which overlies the Eagleford Shale. The elastic nonlinearity of the rocks in the interwell space is indicated by the relative amplitude levels of the harmonics (2,000 Hz, 3,000 Hz, and 4,000 Hz) in the frequency spectrum plot of the crosswell data. The density/porosity logs also show that the lower 30 feet of the chalk has the highest porosity, which is above 15%. The formation is water-saturated. Theoretical work by Donskoy McKee, et al (1997) has established a relationship between elastic nonlinearity of the rock and its porosity. Their studies show that when a seismic wave propagates through a nonlinear rock, harmonics are generated and these harmonics represent the parameter indicating the nonlinearity of the rock. The test results confirm the theoretical predictions. There are little or no harmonics in the data where the seismic signal propagates through non-porous Eagleford Shale.
The relative amplitude of harmonics is a powerful indicator for mapping porosity of the reservoir formations. Shales and clays that are non-porous generate little or no harmonics.
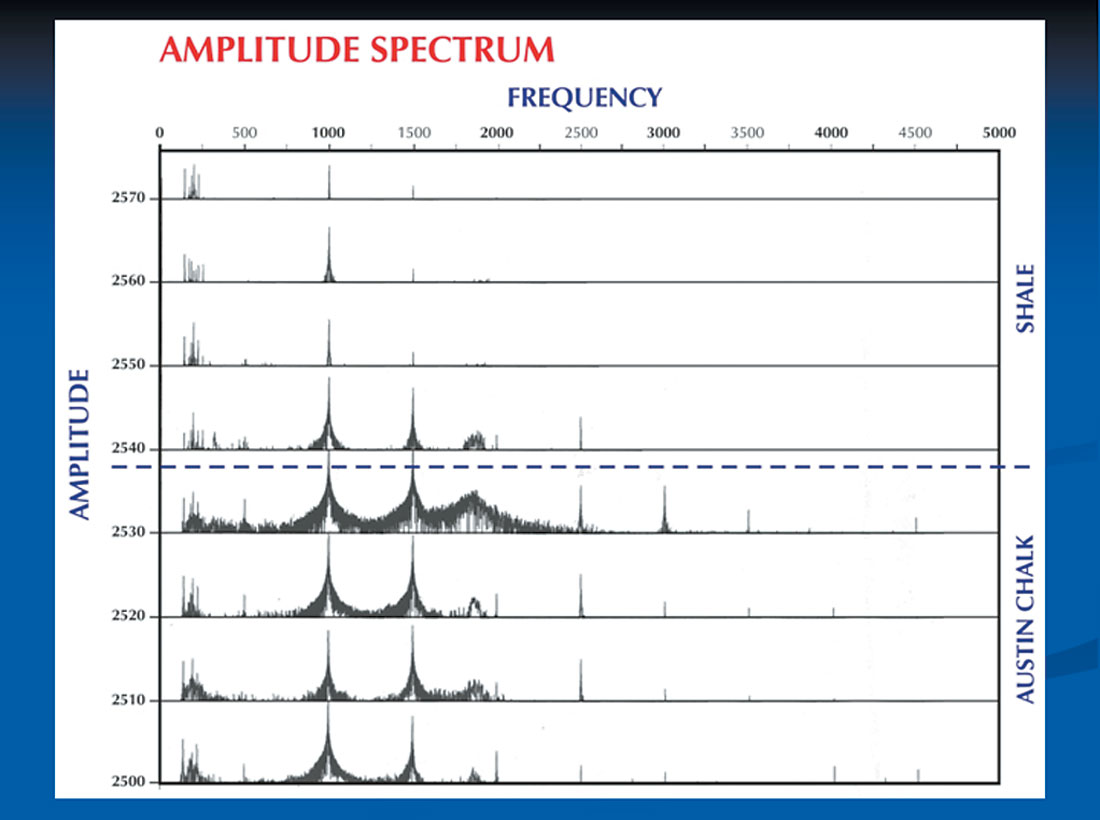
In Figure 2 the crosswell test was repeated using two frequencies transmitted simultaneously: 1,000 Hz and 1,500 Hz. The results confirmed what Westervelt had shown, that in a nonlinear medium two frequencies propagating simultaneously interact with each other and sum and difference frequencies are formed. The sum frequency, 2,500 Hz, and difference frequency, 500 Hz, are noticeable in the Lower Austin Chalk, which has more than 15% porosity. The newly generated frequencies in the form of harmonics and the sum and difference frequencies are a unique nonlinear seismic attribute, which directly correlates with reservoir porosity, fractures, and pore fluids. Notice that the harmonics and sum and difference frequencies are not present in Eagleford Shale just below Austin Chalk. The analysis of the crosswell seismic data shows that the measurement of the relative amplitudes of harmonics and sum and difference frequencies can be used to distinguish and map the reservoir fluid-saturated (porous) and non-reservoir (non-porous) rocks.
Land Seismic Test Recording to Map Porosity (Fluids)
Hydrocarbon reserves (fluids) in a rock formation directly relate to the bulk porosity of that formation. At times, current seismic methods are not very effective in mapping reservoir porosity since the seismic parameters based on the linear elastic model, like velocity, amplitude, and attenuation, show an average variation of 0-10% between porous and non-porous rocks. On the other hand, the nonlinear parameter varies more than one hundred times between porous and non-porous materials.
The higher sensitivity of the nonlinear effects to the porosity and pore fluids of the reservoir rocks provides a new and more effective method of directly mapping in-situ reservoir porosity and fluids. The nonlinear effect that can be easily measured is basically harmonics and frequency mixing between two spectral components. The sum and difference frequencies are generated when two seismic waves propagate simultaneously through a porous and nonlinear rock. The relative amplitudes of these sum and difference frequencies provide a direct correlation with the rock properties (porosity) of the fluid-saturated reservoir formations.
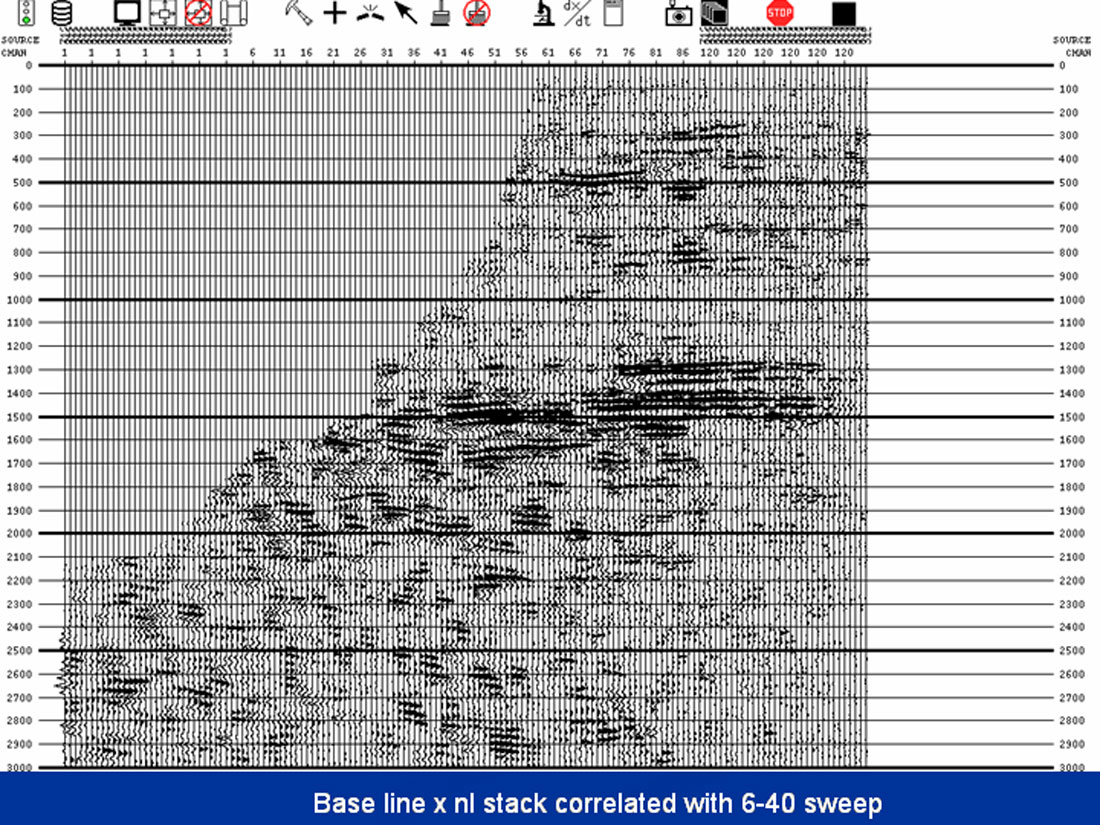
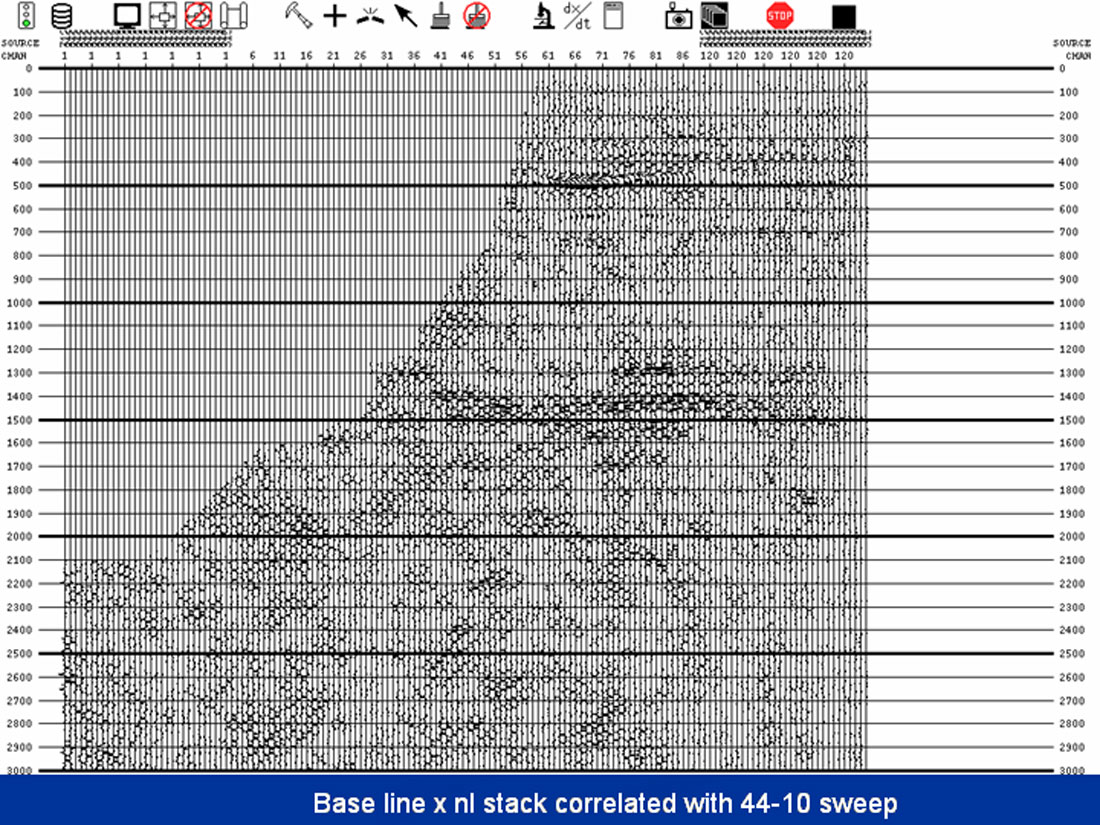
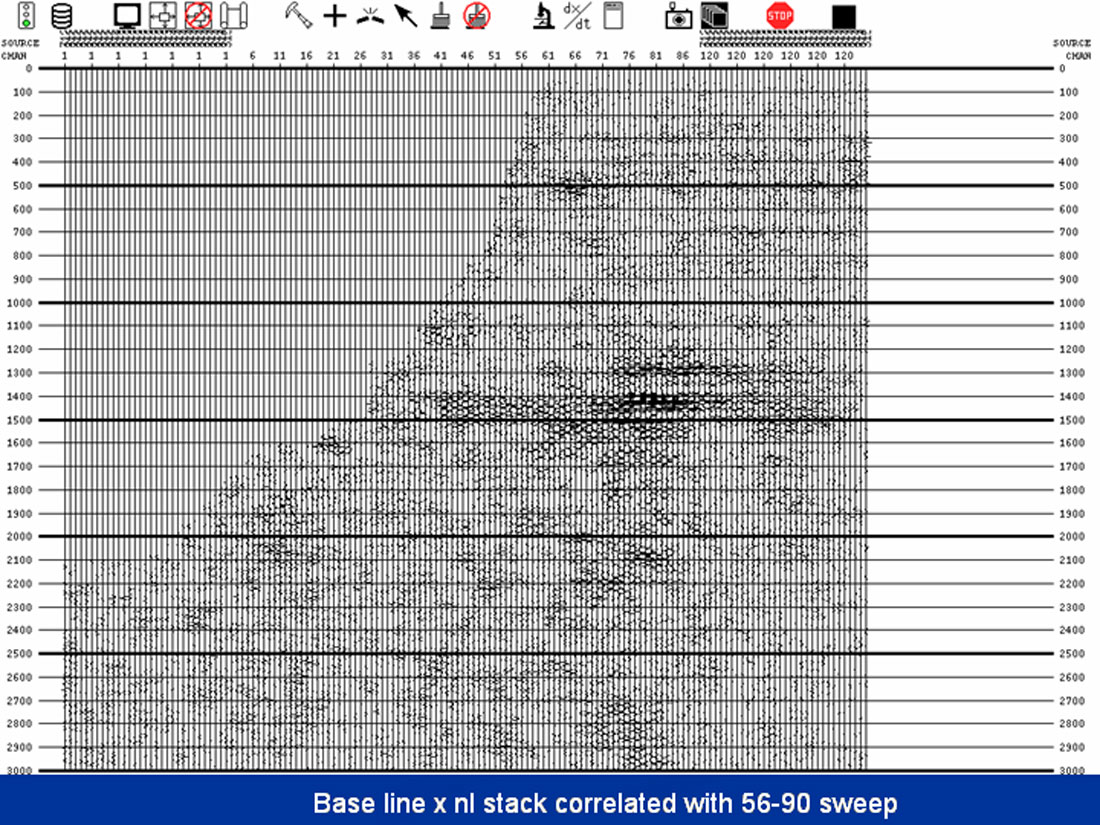
To evaluate this technology, Land Seismic Reflection data were acquired using two sets of surface vibrators acting as one source pattern, and vibrating simultaneously. One set of vibrators were transmitting (6 Hz to 40 Hz) sweep and the other set a mono-frequency (50 Hz) signal. The sum and difference frequency sweeps that are created due to the two signals propagating through the nonlinear porous subsurface formations are (56 Hz to 90 Hz) and (44 Hz to 10 Hz). The recorded data were cross-correlated with the three respective frequency sweeps. Enough two-dimensional data were recorded to perform a Common Depth Point Stack. Figure 3 shows the stacked data examples. There are three data sets. One is the result of cross-correlating the recorded data with (6 Hz to 40 Hz) sweep and represents the standard two-dimensional stacked seismic section of the subsurface. The other two sections are processed after cross-correlating the same data with (56 Hz to 90 Hz) and (44 Hz to 10 Hz) respectively. The two seismic sections that have resulted by cross-correlation with sum and difference frequencies illuminate the nonlinear porous and fluid-saturated rocks in the subsurface. Figure 4 shows the potential nonlinear anomaly. Laboratory results (Los Alamos) and the field data (Crosswell Test) have confirmed that porosity, pore fluids, and nonlinearity of the reservoir rocks a re interrelated. What we have shown by recording and processing 2-D seismic data is that a new seismic imaging method has been introduced that potentially will highlight and display the porosity and pore fluids of the reservoir rocks.

Conclusions
The author believes that integration of conventional seismic and nonlinear seismic can provide the industry with new opportunities for better mapping the in situ reservoir properties. This approach will directly affect the bottom line of any exploration company that wants to differentiate itself from its competition.

Acknowledgements
The author thanks the support given by Apache Corporation, who acquired and processed the Vibroseis land seismic test data.


Join the Conversation
Interested in starting, or contributing to a conversation about an article or issue of the RECORDER? Join our CSEG LinkedIn Group.
Share This Article