Abstract
The multicomponent recording of reflected elastic wavefields allows for an analysis of compressional and shear wave velocities. For seismic arrivals initiated by dynamite sources and reflected from a layered sedimentary system, it is natural to consider both P and P-S reflections as recorded on vertical and inline components of the geophones. Since P-wave and S-wave velocities will differ (roughly by a factor of 2), it is an interpretative art to correlate the P-wave reflections with P-S reflections. In an attempt to correlate or "tie" these reflections, time sections are often stretched and squeezed to match reflection positions. However, the domain in which these reflectors should naturally tie is the depth domain. Depth images for the P-P and P-S reflections can be obtained using depth migration. We illustrate this method of reflector imaging via poststack depth migration "where P meets S" on a data set from the Blackfoot field.
The processed P-P and P-S structure stacks for the 20 m receiver interval data were depth migrated via a reverse-time algorithm using P and S velocities measured in a well directly adjacent to the seismic profile. These depth migrated sections show good correlation over the well interval where velocities were measured. Thus migration of both vertical and converted wave stacked data to the depth domain may provide a much better means of correlation than the current practice of correlating in time which is rather cumbersome and degrades the quality of the data being compared.
Introduction
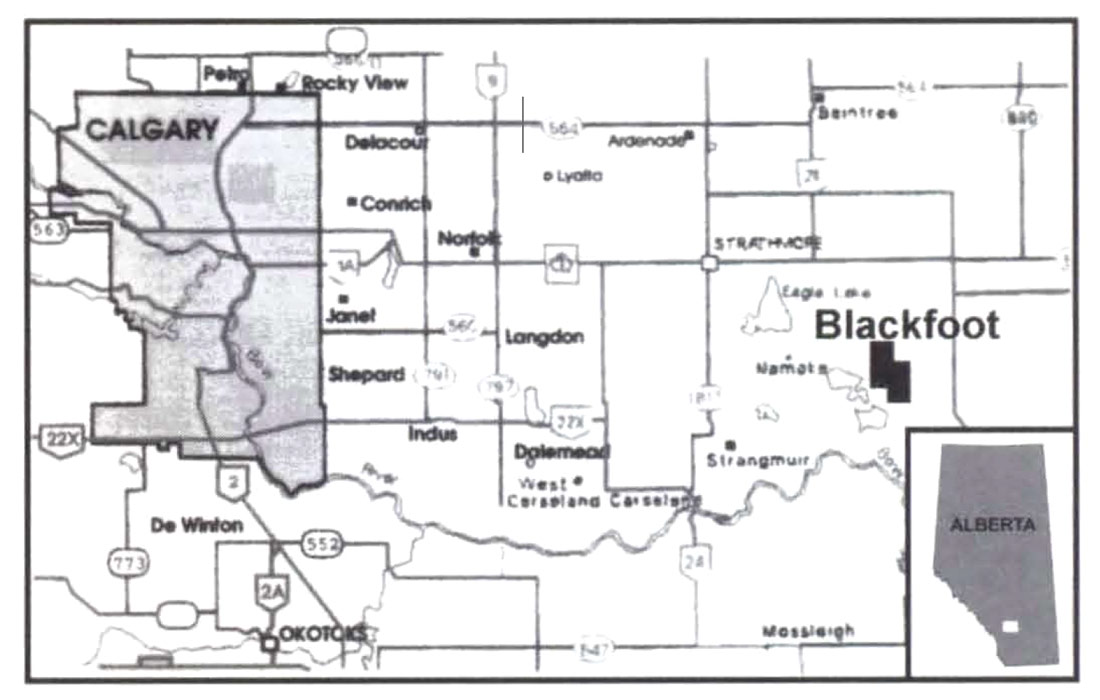
On November 1 - 2, 1997 the CREWES Project a t the University of Calgary with assistance from Boyd PetroSearch Consultants Ltd. and PanCanadian Petroleum Ltd. recorded a unique, high-resolution 3C-2D seismic survey at the Blackfoot field. This field is located some 50 - 55 km east of Calgary near the town of Strathmore, Alberta and its location is presented in Figure 1.
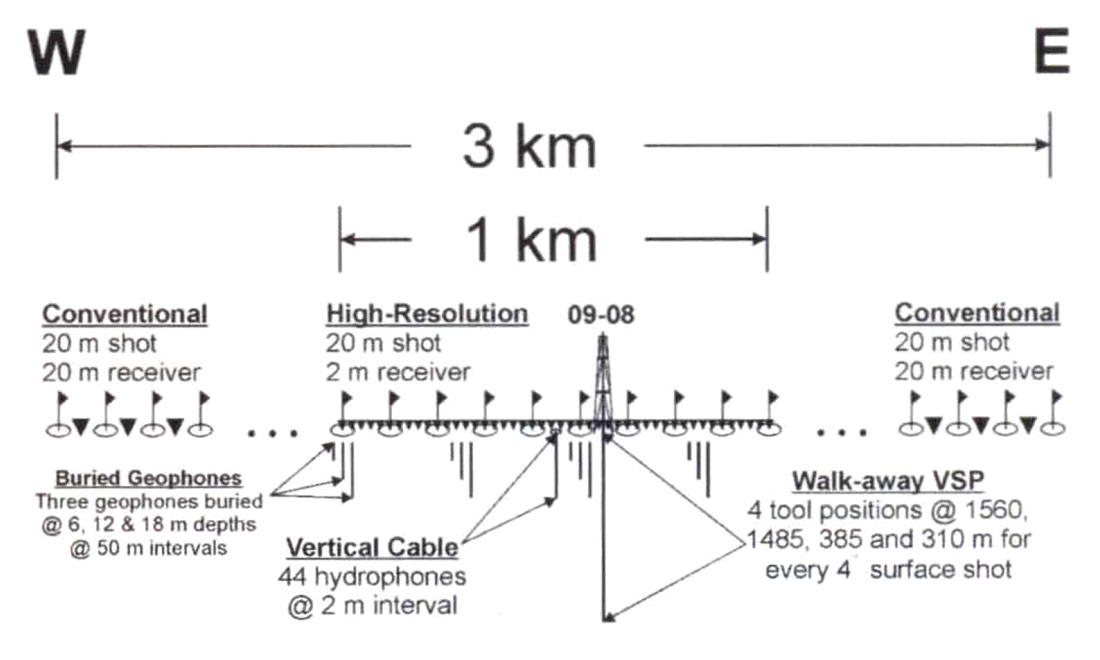
The survey involved the acquisition of a 3 km 3C-2D reflection profile which consisted of a combination of conventional and high-resolution receiver intervals. A schematic diagram of the survey is presented in Figure 2. The source interval employed for the entire 2D profile was 20 m shot on the half-station. However, the receiver interval changed from 20 m to 2 m in the central part of the profile. The survey also involved simultaneous recording into 21?3 buried 3-C geophones situated in 6, 12 and 18 m holes drilled every 50 m along the central km of the profile. In addition to these buried geophones, a 48-channel vertical hydrophone cable with a 2 m receiver interval was deployed in a 100 m cased hole located in the centre of the profile. A walk-away VSP was also simultaneous recorded in PanCanadian's 09-08 well located near the centre of the spread by recording the full range of offsets for each tool position.
Interest in multicomponent seismic data is a result of our ability to discriminate lithology more accurately based on both P (compressional) and S (shear) wave information, rather than by using P-wave data alone. An excellent example of this was given by Ruckgaber (1990). This case history from the Hambert field , Colorado clearly showed how the inversion for P-wave and S-wave velocities allowed for the accurate discrimination between sandstones and shales in the subsurface. Although this case history effectively showed the advantage of using both P-wave and S-wave impedance estimates, P-wave time sections were compared to S-wave sections by compressing S-wave travel times using ratios of P to S isochrons between principal reflectors. One can imagine many rock types where such a time conversion would be difficult.
Therefore, we propose a different strategy for matching elastic wavefields which utilizes depth migration. The strategy is based on the fact that P and S reflected wavefields emanate from the same reflectors at depth. Therefore, if we are to depth migrate the wavefields with accurate velocity estimates, we should correctly image reflectors in depth on both P-P and P-S sections. We demonstrate this by using a data example from the recently acquired Blackfoot 3C-2D high-resolution survey described above. For these multicomponent data, we will deal with comparisons of the "quasi-P" section with the predominantly " P-S" section.
Methodology
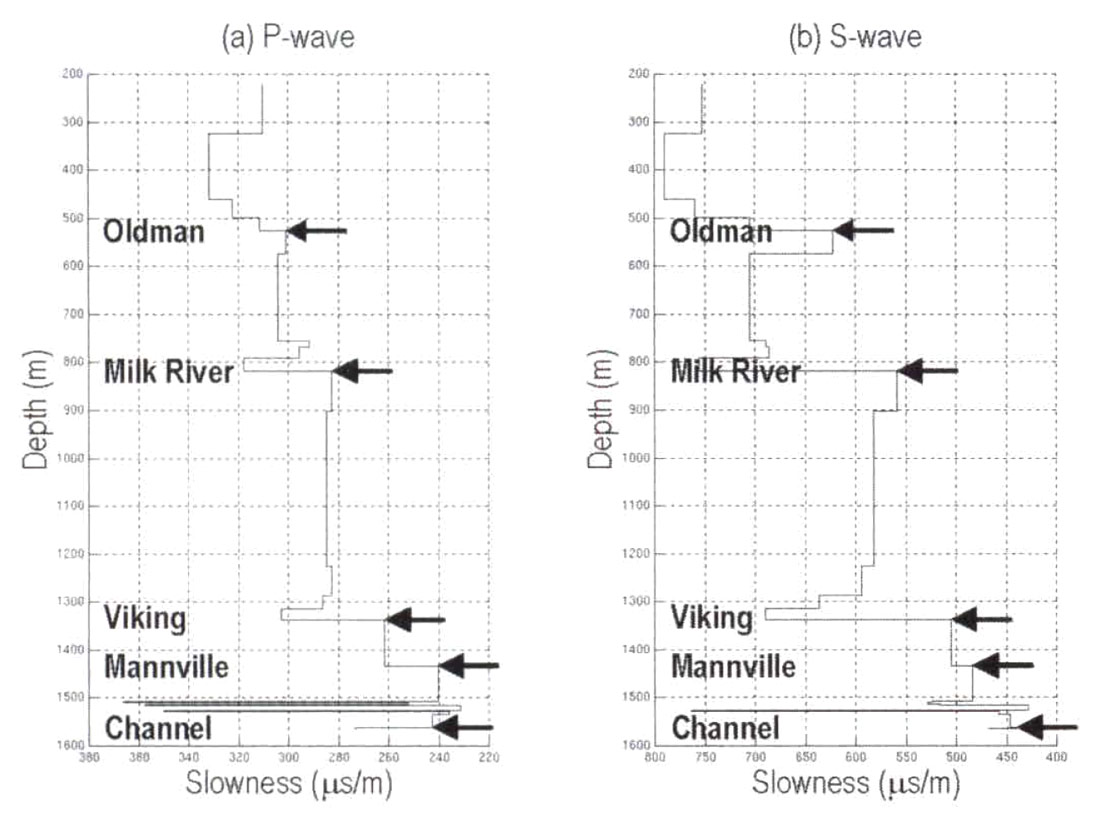
P and S sonic velocities measured in the 09-08 well located adjacent to the seismic profile were used for the reverse-time depth migrations. The velocities were first blocked using the major formation tops to yield P and S interval velocity functions in depth. These blocked velocity logs are presented in Figure 3. In order to generate a interval velocity field for migration of the converted wave or P-S section, an average of the slowness for the P and S blocked logs was used.
Once a velocity-depth model has been established by blocking the logs, the mapping of time sections into depth sections can be achieved by reverse-time depth migration as described by McMechan (1983). For stacked data, the reverse-time depth migration effectively moves the time samples downward to their point of origin by using wave equation propagation. Since the reverse-time method is based on finite differencing of the wave equation, it can be effectively used for any elastic wavefield provided we supply accurate interval velocities for the data sets. For migrating the stacked P-wave data, we use one-way wave propagation with 1/2 of the P-wave velocity. For migrating the stacked P-S data, we use one-way wave propagation with 1/2 of a velocity whose slowness is the average of the P and S slowness values. Since we are dealing with predominantly vertically travelling energy, we use the P-wave and S-wave sonic logs to derive our interval velocities.
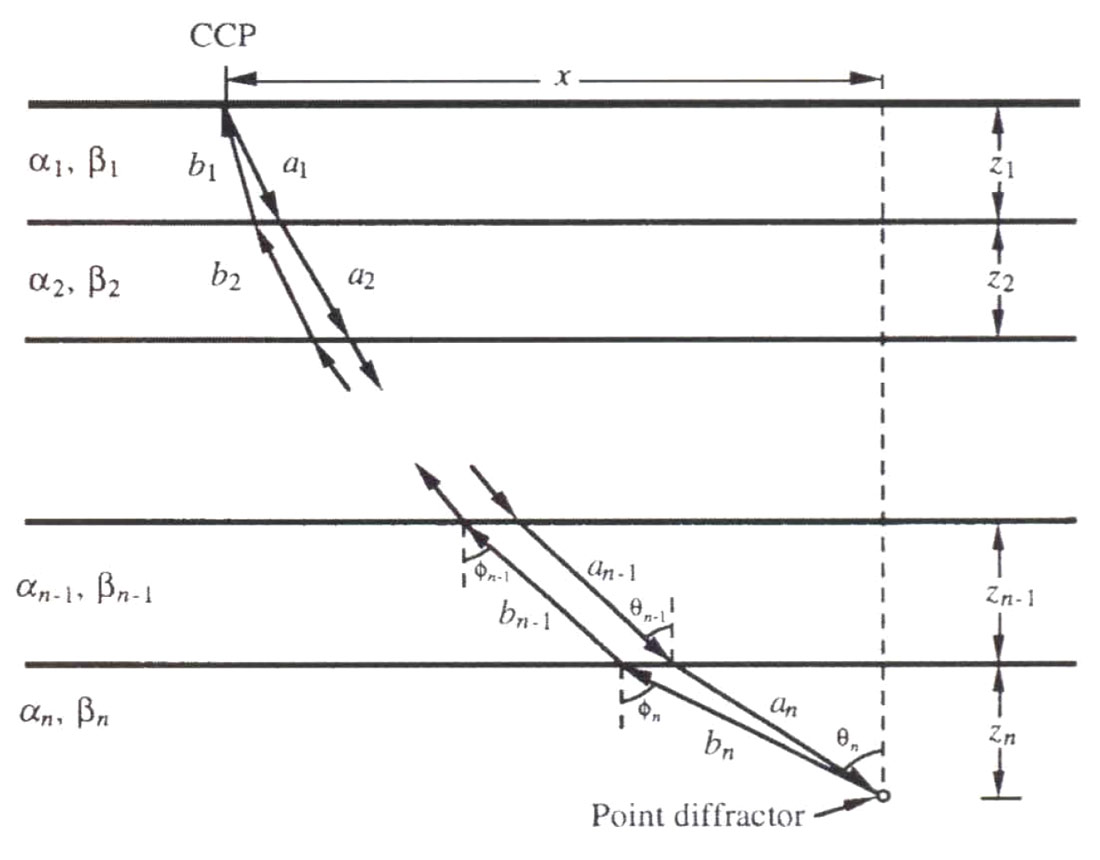
The method that we have used in our reverse-time depth migration of converted wave data uses the assumption of an exploding reflector in which the P-S energy travels with a velocity given by the harmonic average of P-wave and S-wave velocities. Harrison and Stewart (1993) discuss poststack migration of P-S data and show that this model is only strictly correct if the Vp/Vs ratio is constant for all layers. Nevertheless, we show that the approximation of the P-S exploding reflector is valid for the velocity models that we use here in our migration. We validate the model by considering the zero-offset ray paths from a point diffractor through a layered earth whose velocities are given by the P-wave and S-wave logs, as shown by Figure 4.
We also consider a ray path, generally between the P and S rays which represents the P-S exploding reflector ray path, and compare the travel time for these rays. That is we compare the travel time given by equation (1) (Harrison and Stewart, 1993):

to the travel time given by equation (2):

where νmig is the velocity derived by averaging the slownesses and p12 is the ray parameter for exploding reflector ray which gives the endpoints of the ray.
Table 1 shows that for angles of emergence from 0.0 to 0.4 radians (approximately 0° to 23°) that the error from the P-S ray and the "exploding reflector ray" is less than the sampling interval of 1 ms for a 20 layer model. Hence, while Harrison and Stewart (1993) are correct in stating that the exploding reflector model is not strictly exact, it is a very good approximation for the situation that we are dealing with here.
| Angle (radians) | tp+s (s) | tps (s) | % Difference |
|---|---|---|---|
| Tab le 1. Travel times as computed from equations (1) and (2) for a range of emergence angles. | |||
| 0.0 | 1.49971 | 1.49971 | 0.000 |
| 0.1 | 1,51349 | 1.51347 | 0.001 |
| 0.2 | 1,55687 | 1.55677 | 0.006 |
| 0.3 | 1.63711 | 1.63677 | 0.020 |
| 0.4 | 1.77096 | 1.76980 | 0.065 |
In depth migrating these data, we should also note that the velocity logs may not always supply the exact solution and, for some areas of the subsurface, logs are simply not available. In these areas where there is a need to adjust velocity, we can use the least-squares optimization approach proposed by Lines (1993), which adjusted interval velocities so that migrated depths matched the well information. In this case, we use the optimization method to adjust velocities so that the migrated P-P depths match those of the migrated P-S depths, in a least-squares sense.
Conclusions
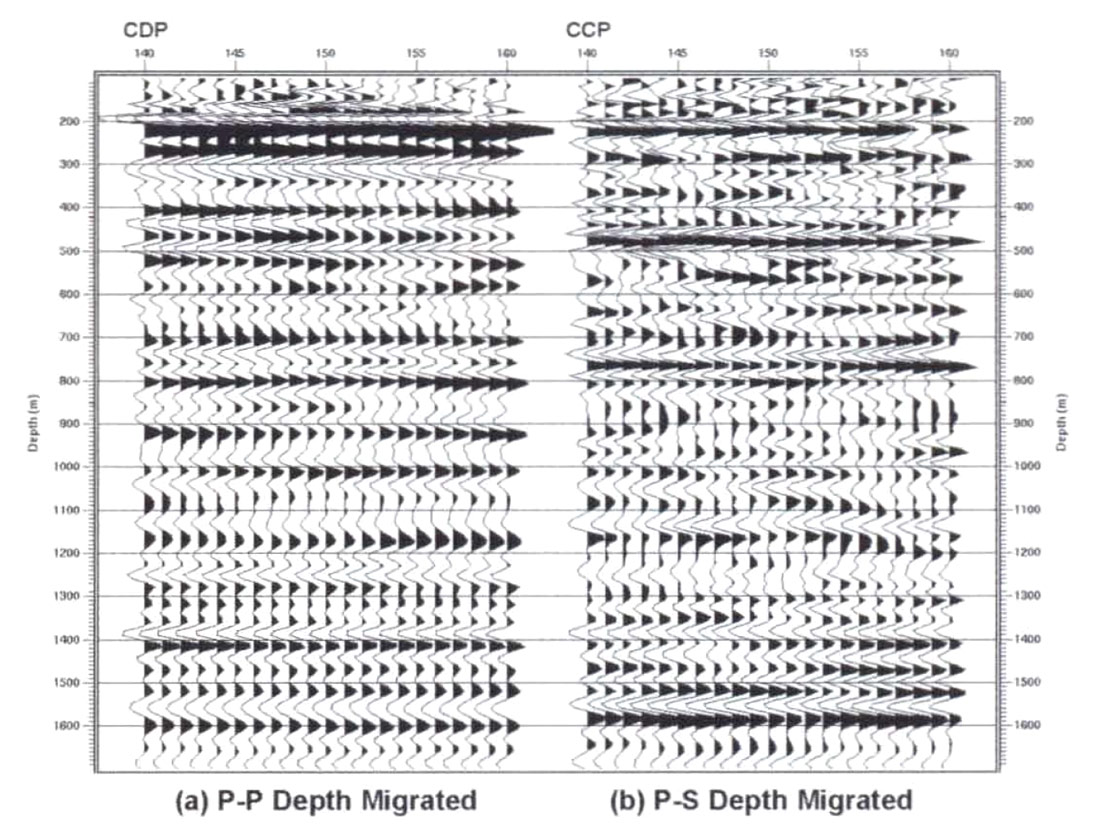
The resultant depth-migrated P-P and P-S sections are presented in Figure 5. The P-wave and P-S reflected wavefields occur at different times on the vertical and in-line stacked sections from the Blackfoot field surveys. Rather than stretching and squeezing time sections to match reflectors, we utilize depth migration and interval velocities deduced from the logs to effectively define the reflector depths. Since reflections emanate from the reflecting beds at depth, the migrated sections show a good tie at depths of the major reflections. We also note that the depth migrated P-S section has similar or perhaps even better resolution (but not SIN levels) than the depth migrated P-P section.

Acknowledgements
We would like to thank Mr. William Goodway and Mr. David Cooper of PanCanadian Petroleum Ltd. and Mr. John Boyd and Mr. Doug Eaton of Boyd PetroSearch for all their assistance in successfully acquiring this unique 3-C survey. We also thank Ms. Han-Xing Lu of the CREWES Project for her assistance in the preparation of the data used for the migrations.


Join the Conversation
Interested in starting, or contributing to a conversation about an article or issue of the RECORDER? Join our CSEG LinkedIn Group.
Share This Article