Due to the recent increase in the rate of seismicity in western Canada and central eastern US from oil and gas activities, there is a high demand for data from seismographic networks to understand ground motion variability and assessment of seismic hazard to the critical infrastructure. In western Canada, efforts have been made to densify publicly-available seismographic stations in areas where fluid injection has been taken place for years. Here, we compile a dataset of ground motion amplitudes from the recent seismic events occurred in Alberta and northeast British Columbia from 2014-2016. Using this public dataset, we obtain a ground motion prediction equation to visualize variation of peak ground motion amplitudes across the region. Although the current dataset is suitable for regional attenuation studies, however, analysis of the variability of ground motion amplitudes at close distances to operations remain challenging due to the sparsity of seismographic stations.
Introduction
The main objective of the induced seismicity studies in western Canada and central eastern US, is to understand how hydraulic fracturing and wastewater disposal are related to initiation of seismic events. These studies are mainly based on the statistical correlation of small-magnitude seismic events with fluid injection and geomechanical/ hydrogeological modeling of fluid diffusivity within the areas with oil and gas activity (e.g. Eaton and Bao, 2016; Atkinson et al., 2016; Keranen et al., 2014). The relation between larger magnitude events (M>4) and fluid injection or the maximum possible seismic event in a region is still unknown and subject to much debate.
To understand the seismic hazard from induced events, analysis of ground motion amplitudes from past earthquakes requires data from all the available seismographic stations. In Alberta and Northeast British Columbia, the recent densification of the publicly-available seismographic stations has increased the chance of acquiring valuable information on ground motion amplitudes, especially at close distances to the source of earthquakes. Beside the publicly available waveforms, operators have also established dense seismographic networks near their operations. These datasets are not usually available for public research due to their confidentiality.
Here, we present some preliminary results of analyzing peak values of ground motion from the recent (potentially) induced seismic events (2014-2016) across Alberta and Northeast British Columbia that were recorded on the publicly-available seismographic stations. Studies of this kind will help understand the general trend of ground motion amplitudes and provide a database of earthquake ground motion for public research.
Database
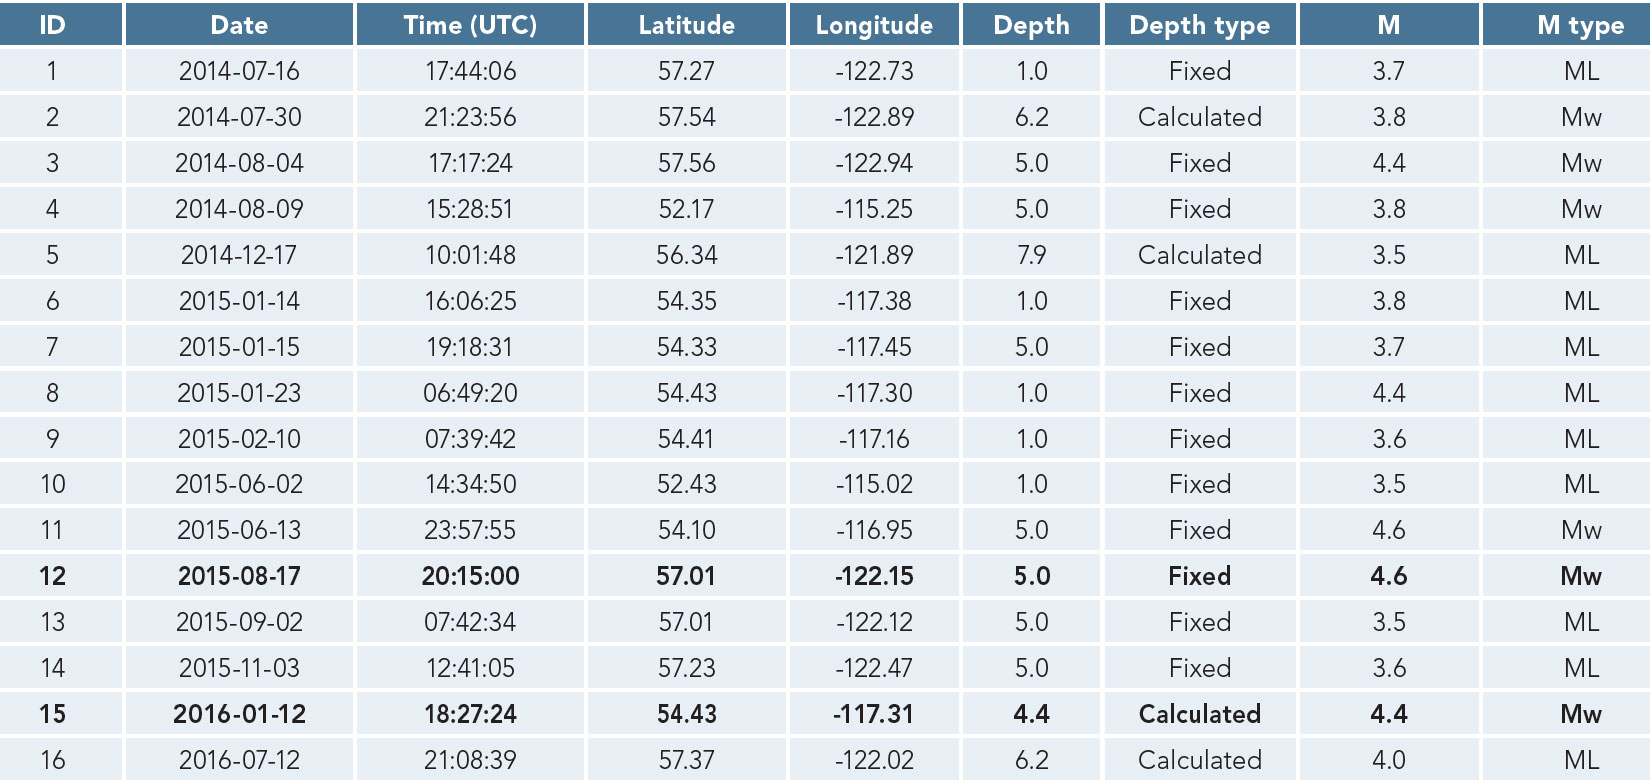
We have acquired waveforms from earthquakes with magnitude 3.5 to 4.6 occurred between 2014 and 2016 across Alberta and northeast British Columbia. We downloaded the waveforms from data repository of the Incorporated Research Institutions for Seismology (IRIS) which holds publicly-available seismic data from seismographic networks across the globe. Instrument response were deconvolved from each waveform to obtain ground motion amplitudes in velocity and acceleration suitable for ground motion studies. Waveforms were also filtered using a high-pass, second-order Butterworth filter with corner frequency of 0.1 Hz. Table one shows the parameters of the events used in this study from the earthquake catalogue of Natural Resources Canada.
A main characteristic of the reported events in the regional earthquake catalogues is the large uncertainty in focal depth determination due to the sparsity of the seismographic stations. As shown in Table 1, most events are assigned a fixed depth during the location process. Information on the depth of seismic events are important since it helps differentiating natural events from shallower induced earthquakes.
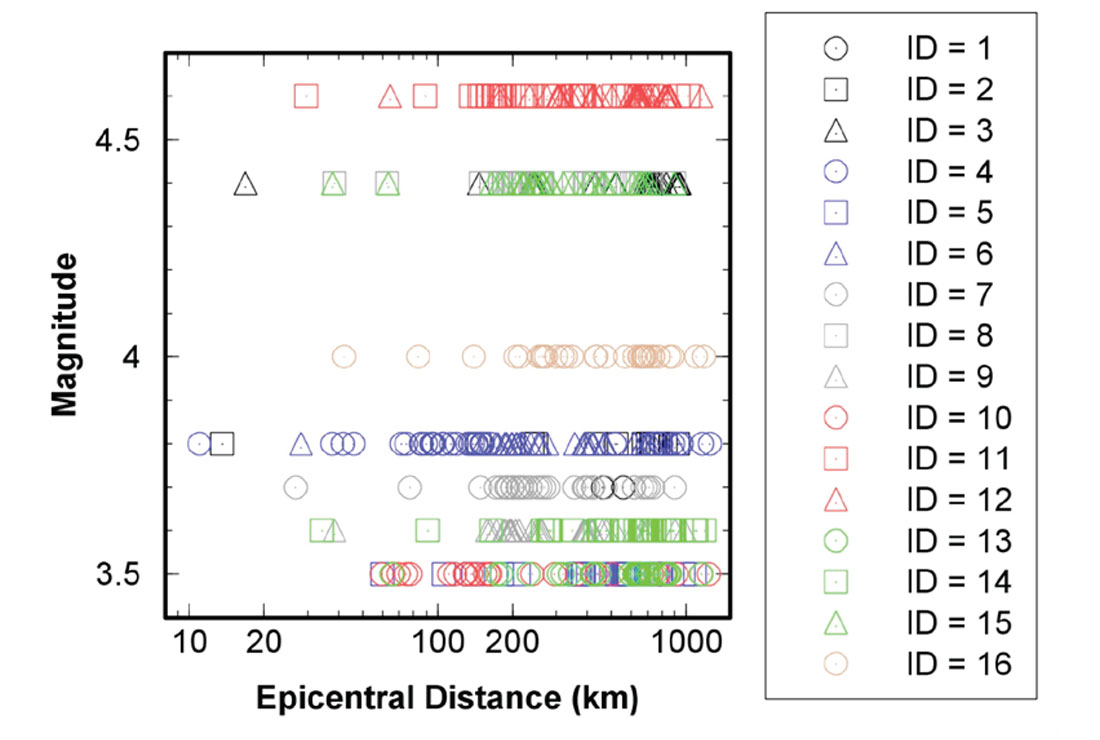
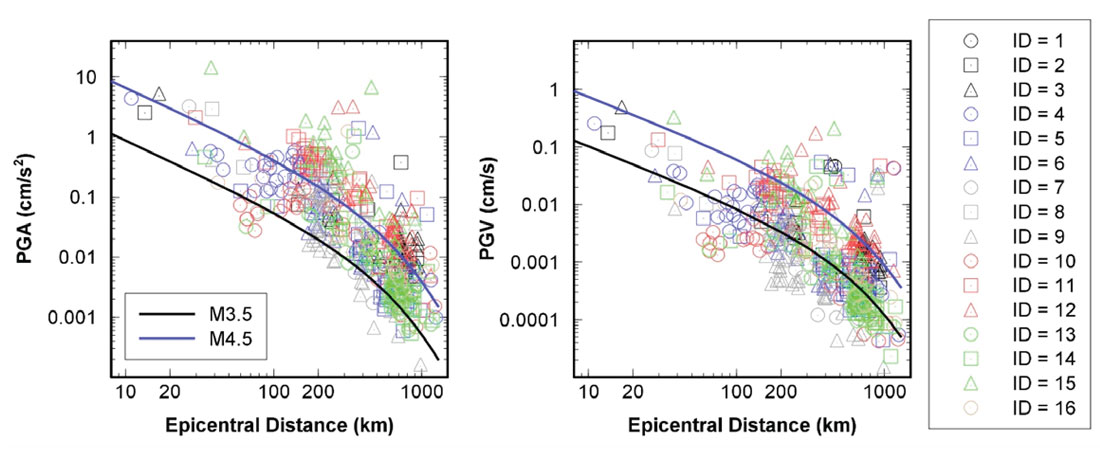
Figure 1 shows the magnitude-distance distribution of the peak ground motion amplitudes (PGA and PGV). Here, we used the largest values from the two horizontal components of each seismographic station. Despite the recent increase in the network coverage, ground motion amplitudes at close distances are still scarce. This can also be observed on Figure 2, which shows PGA and PGV versus epicentral distance. The solid lines in Figure 2 are the Ground Motion Prediction Equation (GMPE) obtained through fitting the following model to the dataset:
Log(Y)=c0+c1 M+bLog(R)+gR+S+σ
In this model, Y is the observed ground motion amplitude, M is magnitude, R is distance (here, the epicentral distance), S is site condition, and σ is the uncertainty. Table 2 shows the determined coefficients. Information on the site condition was obtained from the USGS Vs30 (shear-wave velocity in the top 30 m) data repository. Based on the Vs30 data, we divided seismographic stations into 3 NEHRP (National Earthquake Hazards Reduction Program) site class of B, C, and D and the site condition coefficient, S, was calculated for site classes C, and D relative to the site class B. In Table 2 the combined site coefficent is shown.

Spatial distribution of ground motion amplitudes
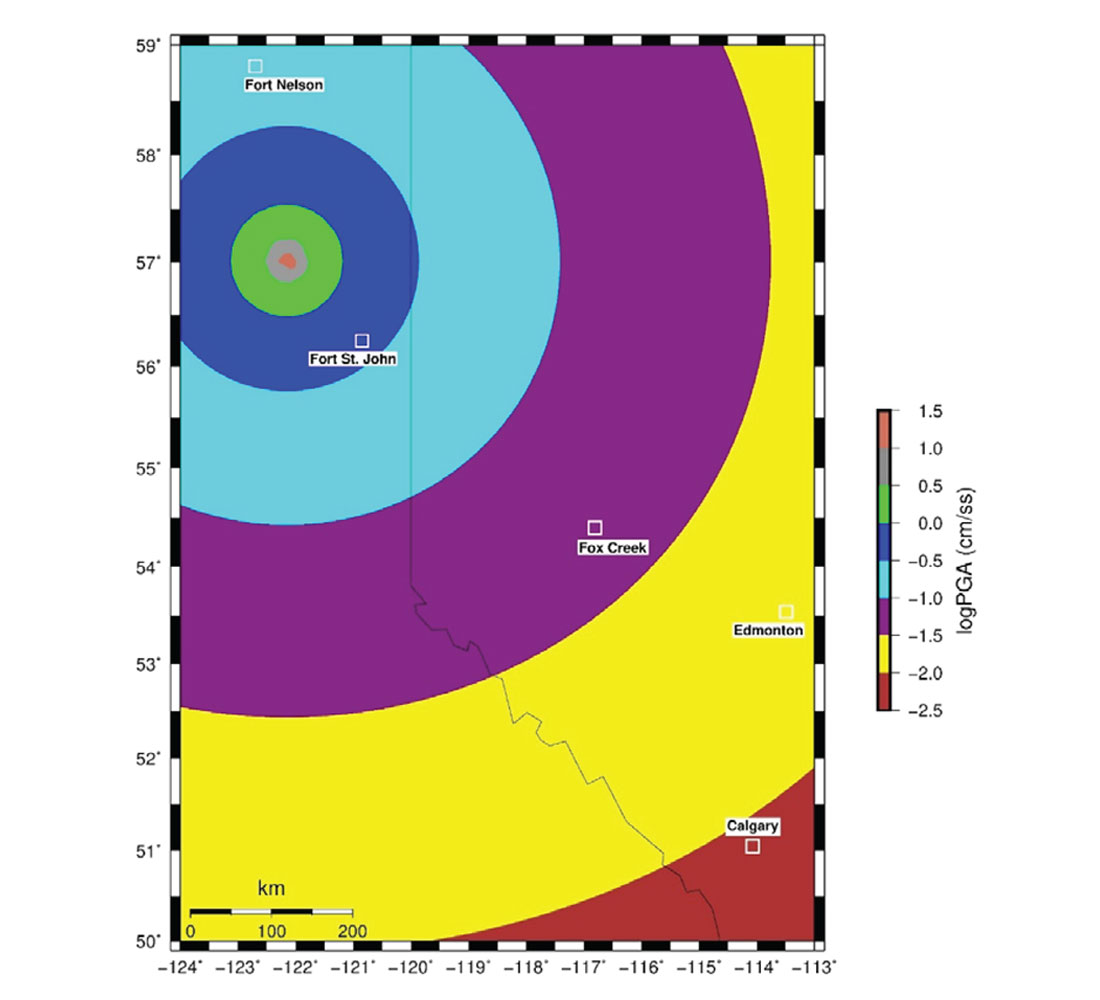
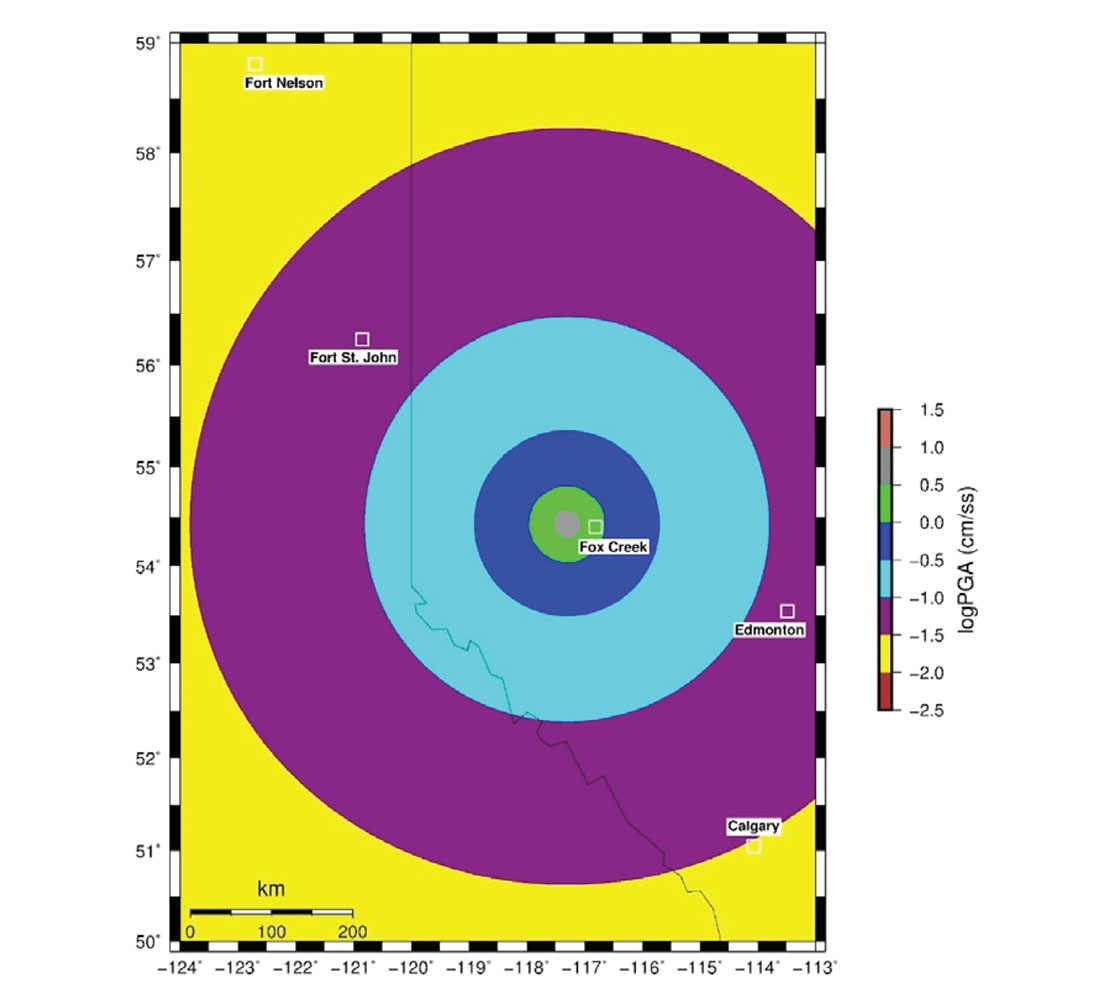
In this section, we plotted the spatial distribution of PGA across the region (Figure 3 & 4). Here, using the GMPE obtained in this study, we calculated PGA values at the nodes of a grid for two events that occurred in 2015 and 2016 in northeast British Columbia and Alberta, respectively. Both events occurred in areas where multi-stage hydraulic fracturing has been taken place for years. The event in northeast British Columbia is the moment magnitude 4.6 occurred on August 17, 2015 in the northern Montney Play while the event in Alberta occurred on January 12, 2016 with moment magnitude 4.4 near Fox Creek in a region where seismic activity has surged since December 2013 (Eaton and Bao, 2016).
Conclusion
A dataset of ground motion amplitudes for the recent seismic events in Alberta and northeast British Columbia was obtained from the publicly- available seismographic stations. Despite the densification of the seismographic networks in recent years, the available magnitude-distance distribution of ground motion amplitudes lack the sufficient data at close distances where the evaluation of seismic hazard is critical for nearby structures. Data from private seismographic networks is essential to fill the gap at distances close to the source of operations to better understand the variability of ground motion amplitudes.


Join the Conversation
Interested in starting, or contributing to a conversation about an article or issue of the RECORDER? Join our CSEG LinkedIn Group.
Share This Article