Horizon-based curvature attributes have been used in seismic data interpretation for predicting fractures ever since the correlation of curvature values to fractures measured on an outcrop was demonstrated. Different measures of curvature (Gaussian, strike, dip, etc…) have been shown by different workers to be highly correlated with fractures. However, all such applications need the interpretation of a seismic horizon, which may be trivial should the data quality be good or the horizon corresponds to a prominent impedance contrast. Horizons picked on noisy surface seismic data or when picked through regions where no continuous surface exists could possibly lead to misleading curvature measures. A suggested way out of such problems is to run spatial filtering on horizon surfaces, taking care to remove the noise and still retain the geometric detail on them.
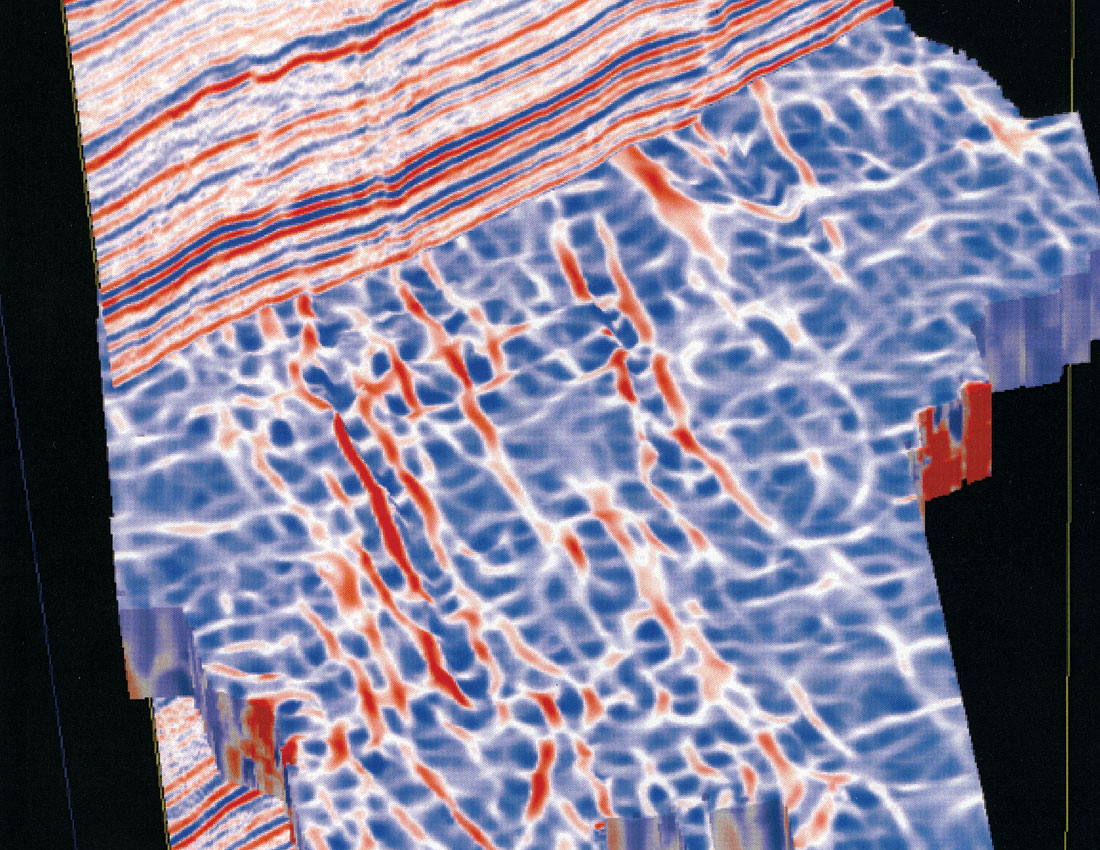
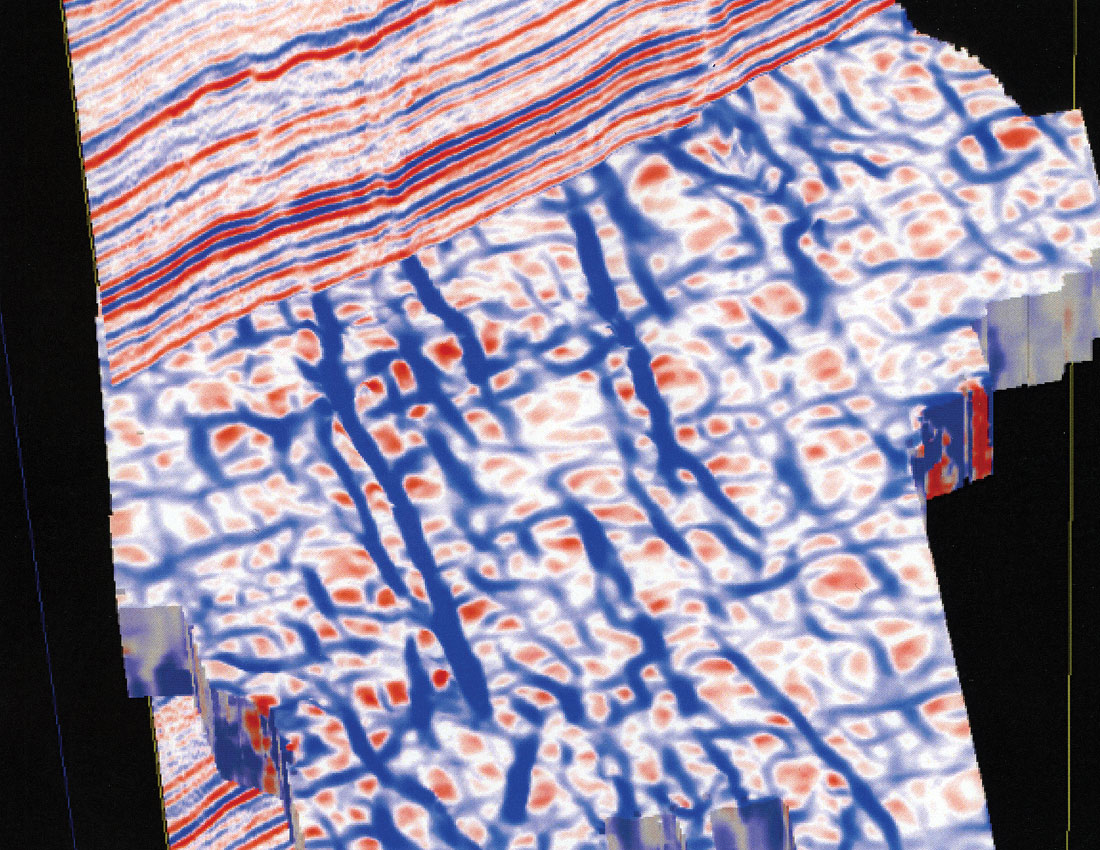
A significant advancement in the area of curvature attributes has been the recent introduction of volumetric estimation of curvature. This volumetric estimation of curvature alleviates the need for picking horizons in regions through which no continuous surface exists. Besides, it is possible to do a multispectral curvature analysis of different features contained in the seismic data volumes, and add value to its interpretation. This presentation will show the results of investigations into both horizon-based and volumetric curvature attribute applications. In spite of adopting spatial filtering, horizon-based curvature estimates may still suffer from artifacts. Curvature attribute values extracted from curvature attribute volumes along the same set of horizons yields displays that are free of artifacts and make more geologic sense. In Figure 1 we show a zoom of the time slices from coherence, most-positive (long-wavelength) and the most-negative (long-wavelength) curvature volumes intersecting a seismic crossline. Notice how the red peaks (Figure 1b) on the fault lineaments (running almost north-south) correlate with the upthrown signature on seismic. Similarly, the most-negative curvature time-slice intersecting with the seismic crossline (Figure 1c) shows the downthrown edges on both sides of the faults highlighted in blue.
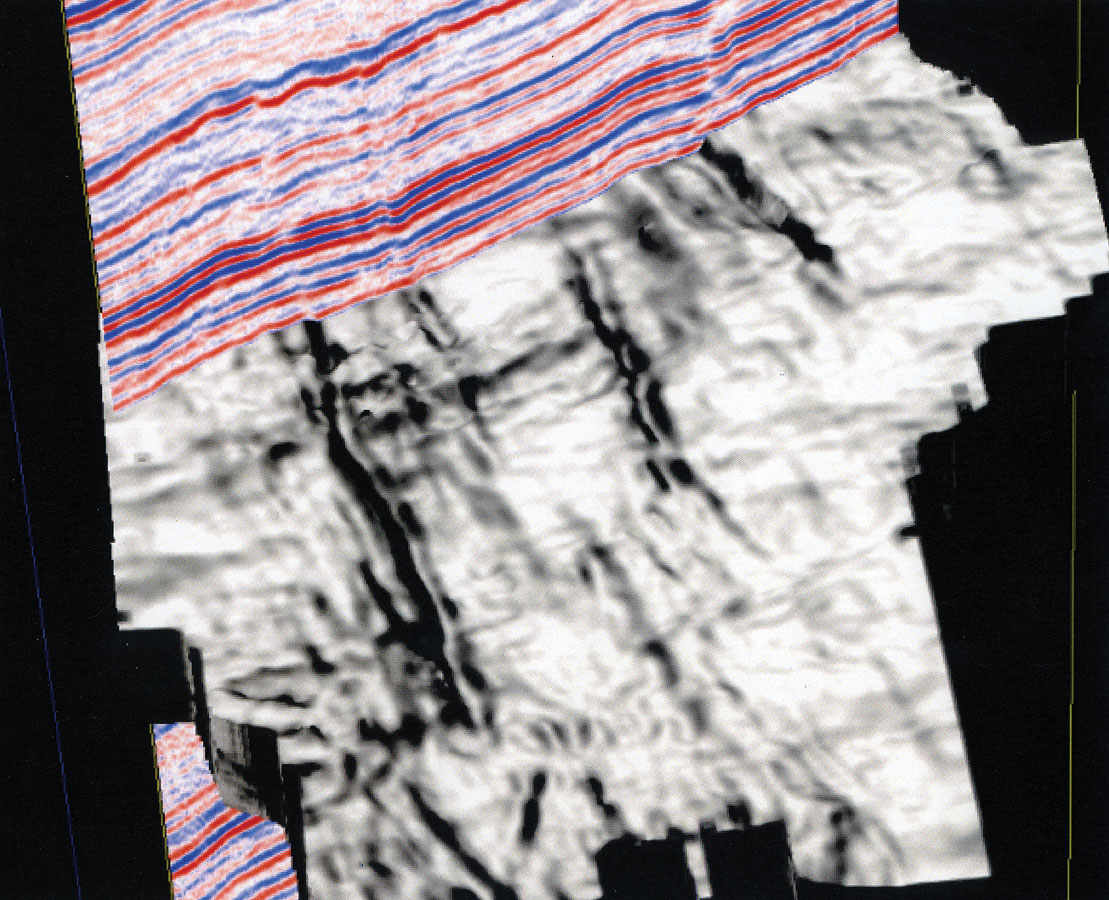
Coherence measurements in three dimensions represent the trace-to-trace similarity and therefore produce interpretable changes. Similar traces are mapped with high coherence coefficients and discontinuities have low coefficients. Regions of seismic traces cut by faults, for example, result in sharp discontinuities in trace-to-trace coherence, producing delineation of low coherence along fault planes. Since three-dimensionality is an essential ingredient of coherence computation, faults or fractures in any orientation are revealed equally well. Stratigraphic features generate similar discontinuities resulting in sharp detection of reef and channel boundaries and deltaic sediments. An attractive characteristic of coherence volumes is that it gives an unbiased view of the features in the seismic volume – no interpretation is required for viewing them.
Since the introduction of the coherence attribute in 1995, there has been a constant up-gradation of this technology by way of more refined algorithms, displays, applications and methodologies, aimed at extracting more meaningful detail that not only aid interpreters, but help them be much more accurate and time effective.
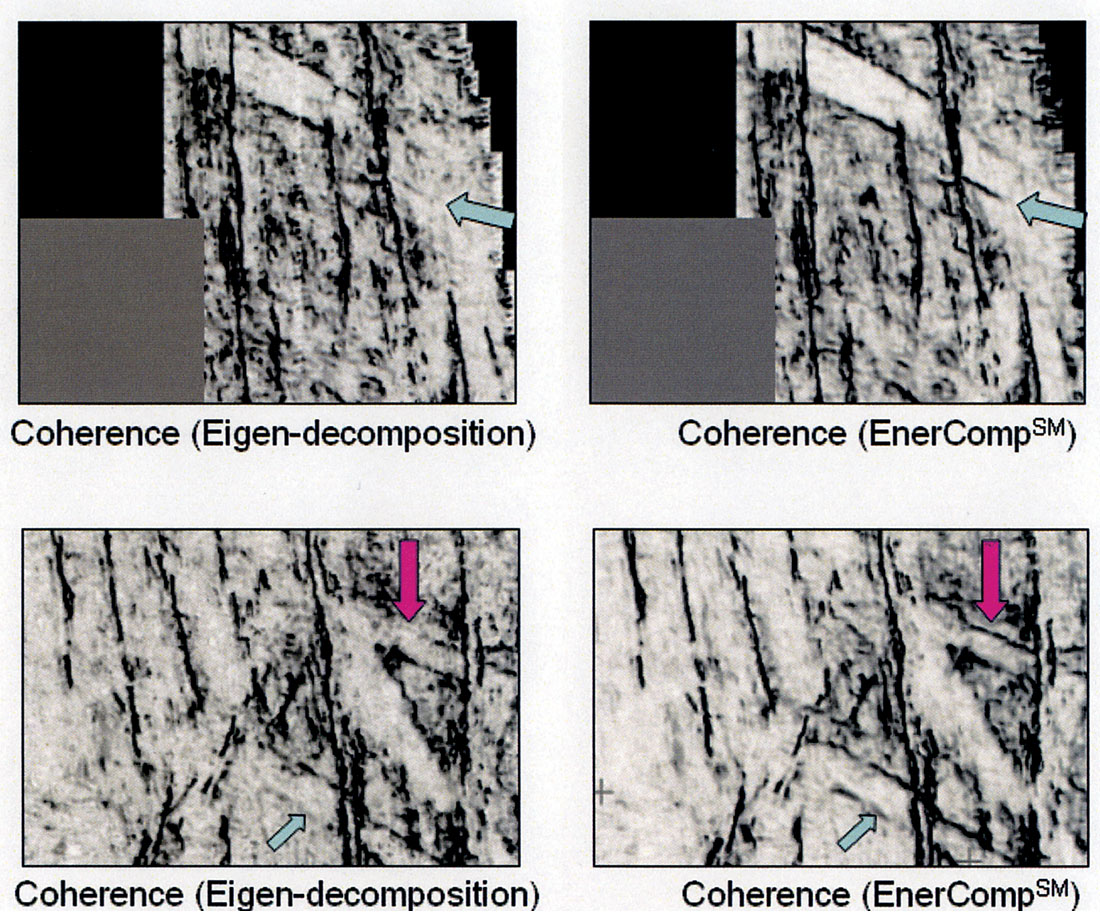
The original algorithm for coherence computation was based on cross-correlation of seismic traces. Thereafter semblance and eigenstructure decomposition algorithms were introduced. While the semblance algorithm provides more robust estimates for coherence even in noisy environments and higher vertical resolution (for good quality data) the eigenstructure algorithm, being mathematically more rigorous, produces sharper and clearer images. A recent algorithmic development (EnerCompSM) in this regard yields coherence output that is crisper and better focused. Figure 2 shows examples comparing the performance of the eigen-decomposition and EnerCompSM algorithms. Notice the better focusing of the events indicated with arrows.
Examples will be presented for the application of curvature and coherence attributes to 3D seismic volumes to show how these attributes can aid the geophysicist in making more accurate interpretations.


Join the Conversation
Interested in starting, or contributing to a conversation about an article or issue of the RECORDER? Join our CSEG LinkedIn Group.
Share This Article