We demonstrate the application of Poisson impedance (PI) inversion for characterizing sandstone reservoirs encased in shale, when the impedance contrast between them is very small. Poisson Impedance is defined as the difference between the P-impedance (IP) and a scaled version of the S-impedance (IS), where the scalar (c) can be determined from the slope of the regression line between IP and IS. Using well data, if the PI curve is correlated with the Gamma Ray (GR) curve, the porosity (φ) curve, or the water saturation curve for different values of c, it is possible to determine the maximum correlation coefficient in each case. The c value corresponding to the maximum correlation coefficient for GR is used to compute another attribute called lithology impedance (LI). Similarly, fluid impedance (FI) can be computed using the c value that corresponds to the maximum correlation coefficient for the porosity (φ) curve. The cross-plot between LI and GR shows the advantages of LI in distinguishing sandstone from shale. Pore content is predicted using the linear relationship exhibited on the cross-plot of FI versus φ.
Introduction
The increasing demand for oil and gas motivates geoscientists to not only explore new reservoirs but to try and characterize the existing ones in a robust way as well. One of the challenges in doing so is to be able to differentiate lithology and fluids in the reservoir. Rock physics constants such as, bulk modulus (k), shear modulus (μ), Young’s modulus (E), Lambda-rho (λρ), and Mu-rho (μρ) attributes are commonly used for discriminating lithology (sandstones versus shale) or fluids (gas, oil, water). P-wave velocity (VP) and S-wave velocity (VS) or P-impedance (IP) and S-impedance (IS) plus density (ρ) are prerequisites for the computation of all the attributes mentioned above. Over the last few years, pre-stack seismic inversion has been used to estimate these attributes. This seismic inversion yields IP, IS, Poisson’s ratio (via VP/VS ratio) and density. The robust determination of density from seismic requires really long offsets and noise-free data which is seldom available. In order to avoid this stringent requirement of density, we usually compute it as its product with other attributes such as λρ, μρ, kρ and Eρ. Finally, the cross-plotting pair of these attributes is used for discriminating lithology and fluid content.
The method
It is usually noticed that the cross-plotting of IP versus IS for data from a thin zone enclosing a gas sand reservoir yields a cluster of points corresponding to gas sand somewhat separated from the cluster of points coming from the background shale. The separation between these clusters depends on the impedance contrast between the litho-fluid and background lithology. Moreover, for enhanced separation between gas sand and background shale, another attribute combination such as the λρ - μρ cross-plot is used. This cross-plot exhibits more separation as gas sand shows lower values of λρ and higher values of μρ than the background shale.
On these cross-plots, it may be difficult to discriminate the lithofluid distribution where clusters are not completely separated. But in such cases, rotating the axes to be parallel with the trends would ensure a distinct discrimination of the litho-fluid distribution. This rotation can be achieved by computing an interesting attribute namely Poisson impedance (Quakenbush et al., 2006). It incorporates the information of Poisson’s ratio and density. Mathematically, it can be expressed as PI = IP – cIS where c is the term that optimizes the rotation. The value of c needs to be determined from the regression line of the cross-plot of the IP and IS logs for the wet trend. The inverse of the slope can be used as the c value. Additionally, the target correlation coefficient analysis (TCCA) method (Tian et al., 2010) can be used to calculate c.
The automatically generated correlation coefficient between the PI curve with different c values and the Gamma Ray and porosity curves is computed. The c value corresponding to the maximum correlation coefficient for GR is used to compute an attribute that would emphasize lithology and so is known as lithology impedance (LI). Similarly, fluid impedance (FI) is computed using a c value that corresponds to the maximum correlation coefficient for the porosity curve (Direzza et al., 2012). Cross-plots between LI and GR can now be constructed that show the advantage of LI in distinguishing sandstone from shale. Fluid content is predicted using the linear relationship exhibited on the cross-plot of FI versus φ.
Examples
In the present study, we demonstrate the application of the above methodology for characterizing the sandstone of Halfway and Doig Formations of northeastern British Columbia, Canada. The Doig Formation is generally a mixture of shale and siltstones. The lower levels of the Doig Formation are radioactive, whereas the upper levels are not. The contact between the Doig and Halfway Formations is more problematic but is generally assigned to the top of the uppermost prominent shale interval below the distinct and widespread sandstone facies assigned to the Halfway sandstone. However, in places relatively thick sandstone in the Upper Doig Formation are developed near or immediately below the Halfway Formation sandstone, and this poses a problem in assigning the contact between the two formations. Locally, tidal channels, which are part of the Halfway shore-face cut into the Doig siltstones and shale, and again create difficulty in distinguishing the two formations.
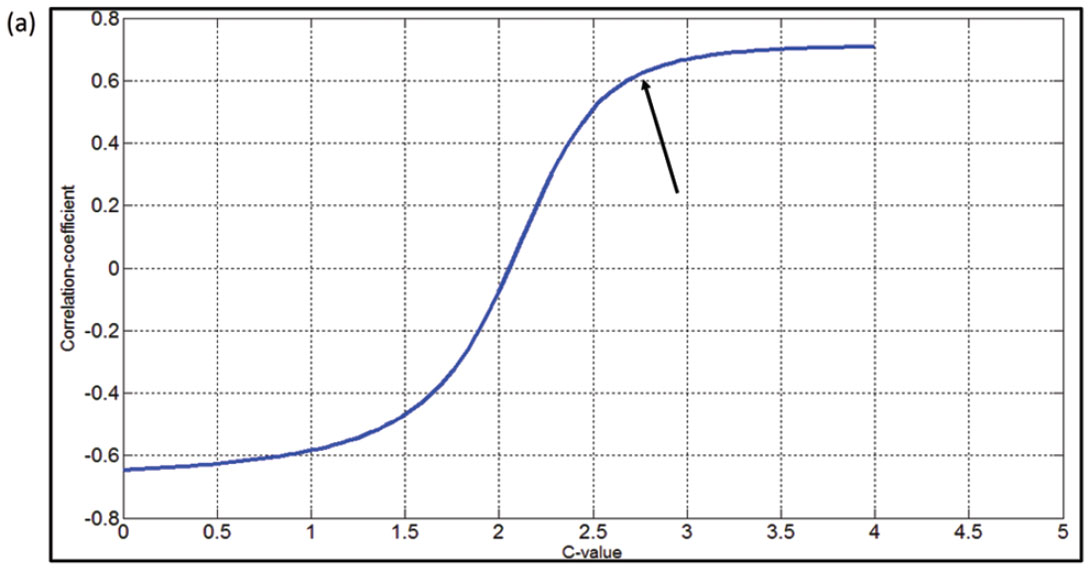
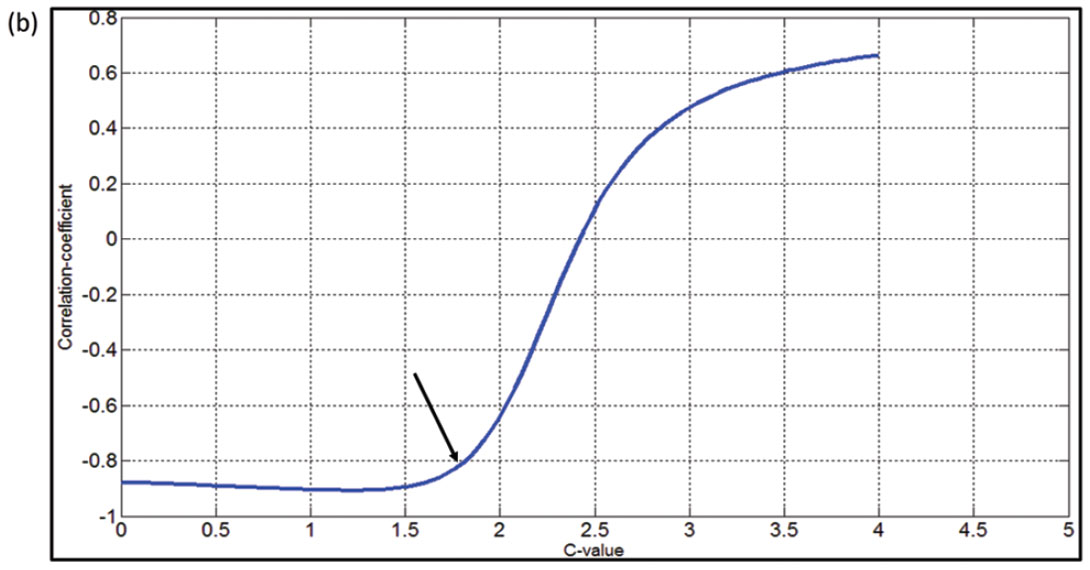
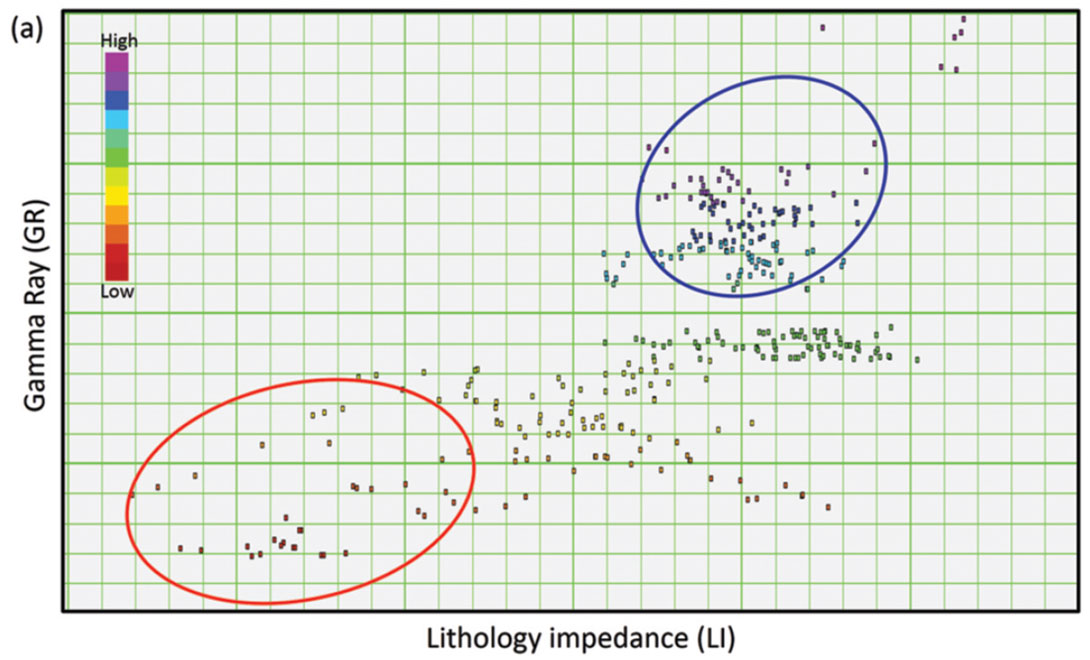
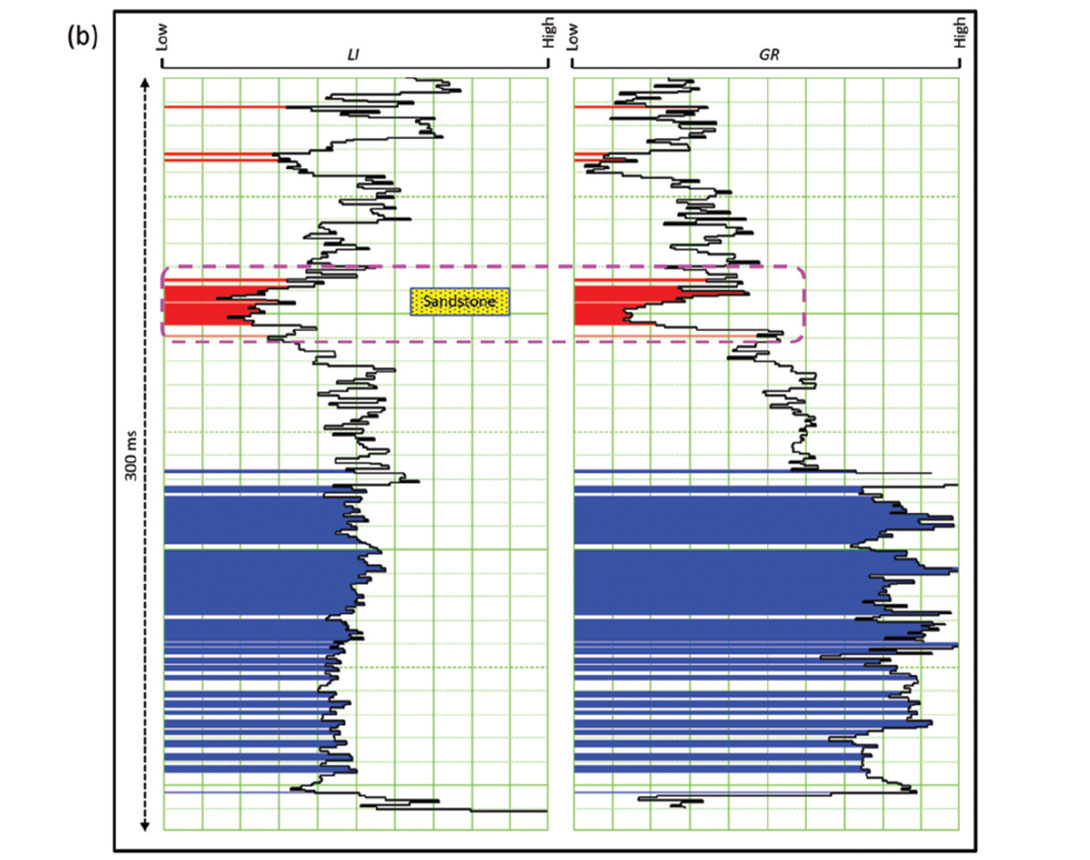
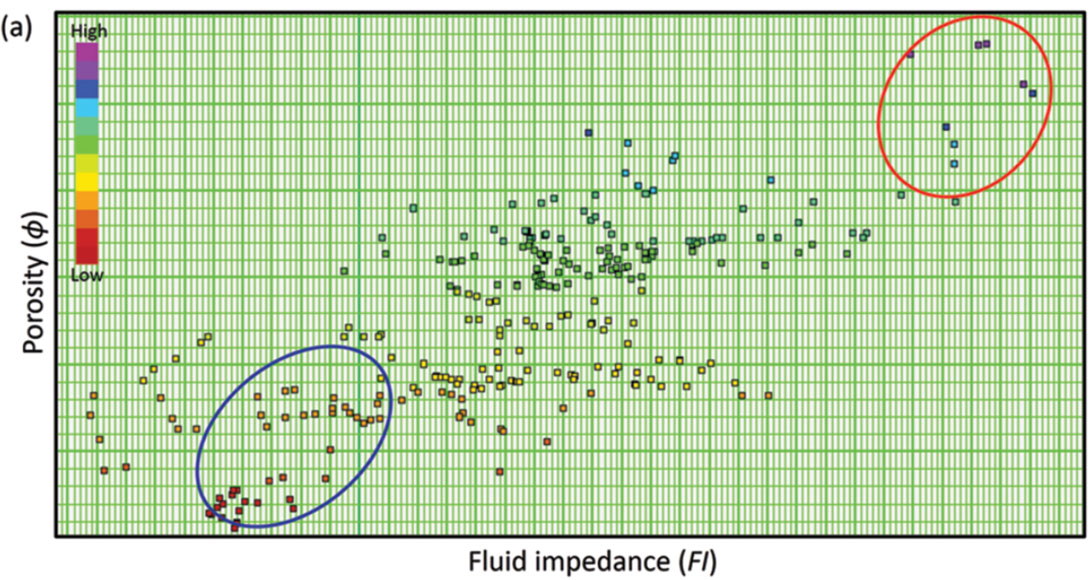
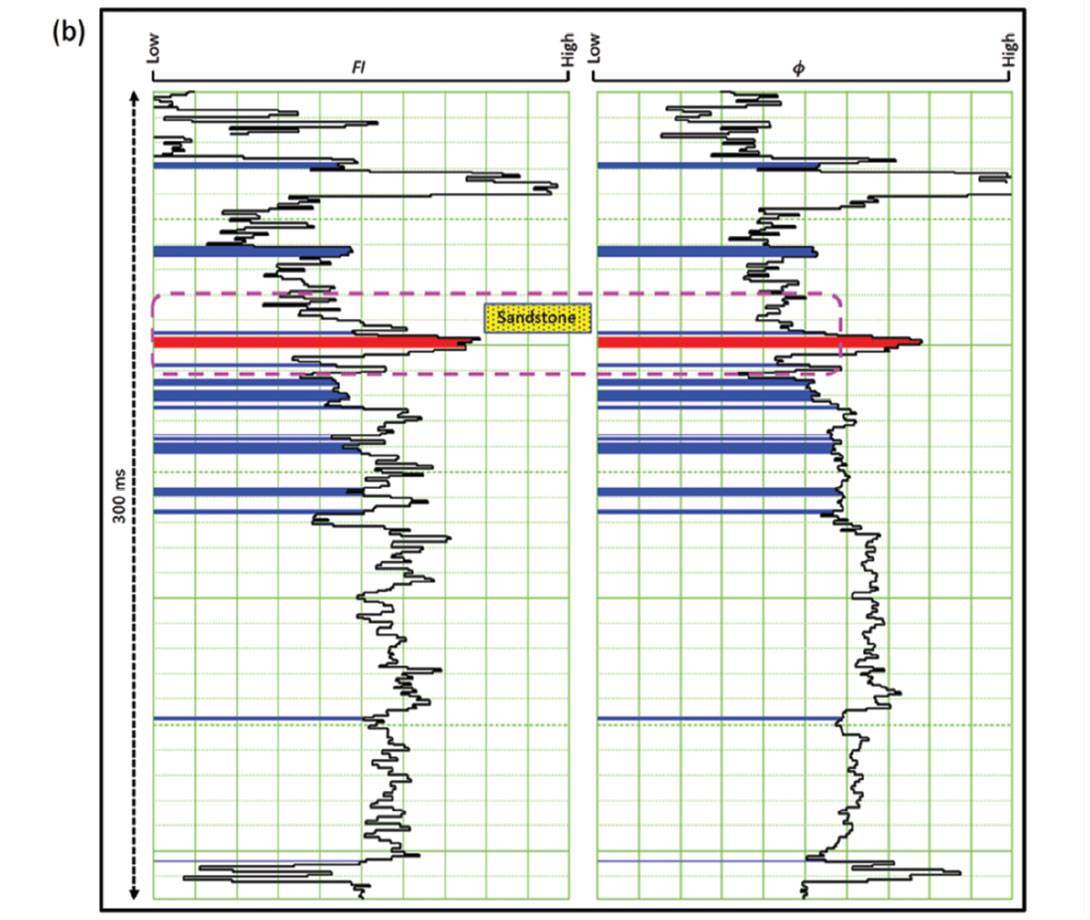
In this study, we automatically calculate the correlation coefficients between the PI curve with different c-values versus the GR curve and the porosity (φ) curve. This correlation of PI with GR is shown in Figure 1a. The maximum correlation coefficient reached in Figure 1a for the c-value is 2.78 (cc=0.678). Similarly, the correlation of PI with φ is illustrated in Figure 1(b). The c-value 1.75 (cc=-0.875) corresponding to the maximum correlation of the PI with the porosity curve is noticed. Thus, Poisson impedance attributes, namely, Lithology impedance (LI) using equation IP - 2.78*IS, and Fluid impedance (FI) using equation - (IP - 1.75*IS) can be derived. They are useful because of their sensitivity to lithology and porosity respectively. The cross-plot of LI versus GR is shown in Figure 2a. On this the red polygon encloses the points having low LI and GR while points corresponding to high LI and GR are enclosed by the blue polygon. The back projection of these polygons on well-log curves is shown in Figure 2b. Notice that the points corresponding to red polygon are coming from the Halfway sandstone while the shale formation is highlighted by the points coming from blue polygon. Thus, the cross-plot of LI versus GR shows the advantage of LI in distinguishing sandstone from shale. The cross-plot of FI versus f is shown in Figure 3a and it shows that we can predict the porosity information from its “linear relationship”. Two polygons corresponding to high and low (FI, φ) are considered on this cross-plot. The back projection of these as shown in Figure 3b reveals that the high (FI, φ) corresponds to Halfway sandstone while shale exhibits low (FI, φ).
Poisson impedance from seismic data
The workflow for Poisson Impedance (PI) involves computing IP and IS volumes from pre-stack seismic data. For computing these prerequisites, simultaneous inversion is performed. This inversion method facilitates the estimation of the P- and S-impedance directly from the pre-stack seismic gathers, without first estimating the P- and S-reflectivities from pre-stack seismic data and then transforming them to impedance. In this inversion, we start with an initial low-frequency model and generate synthetic traces from it. For generating synthetic traces, angle dependent wavelets are computed statistically from the input data by assuming it to be zero phase, and are then convolved with the modeled reflectivities. Further, the model impedance value is changed in such a manner that the mismatch between the modeled angle gather and the real angle gather is minimized in a least squares sense. Having IP and IS volumes, LI and FI are then derived using equations derived from well log curves analysis.
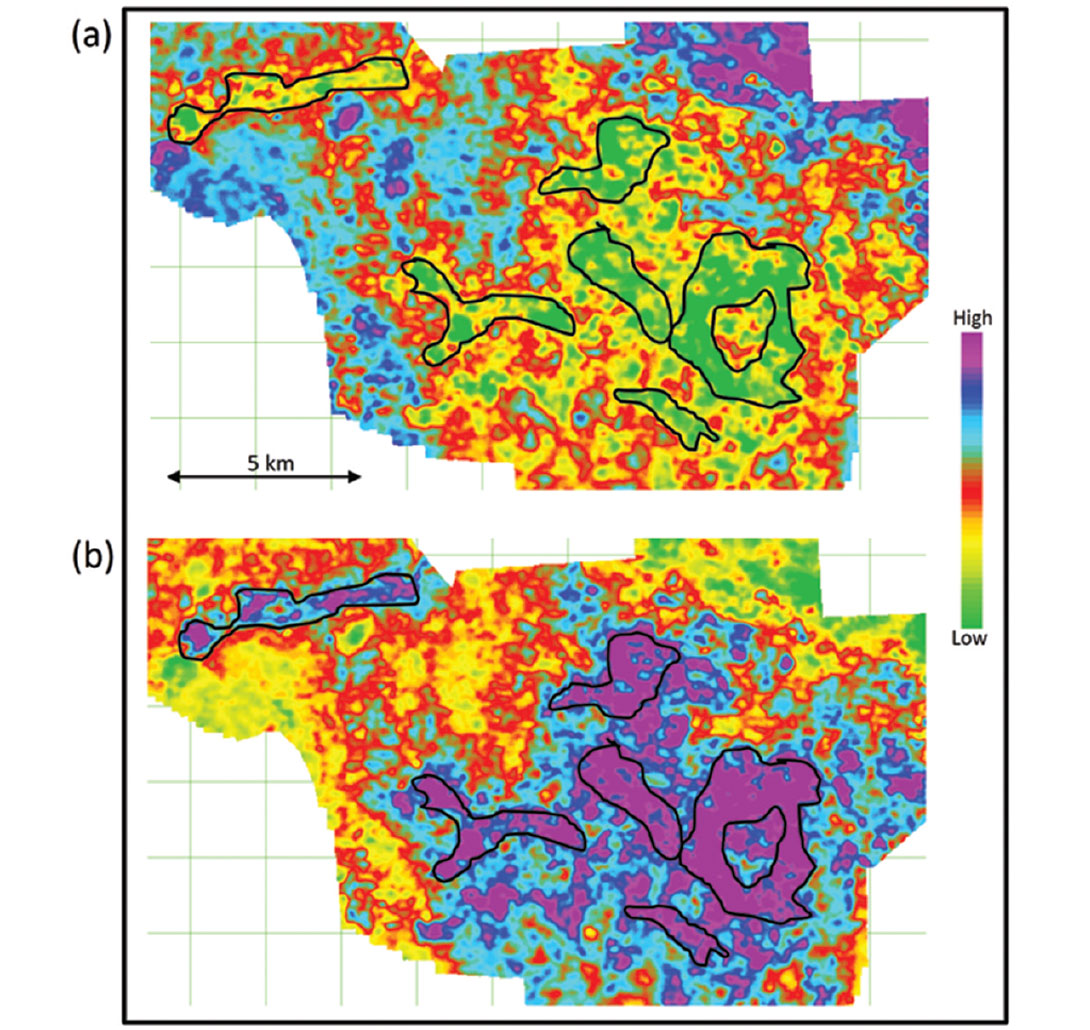
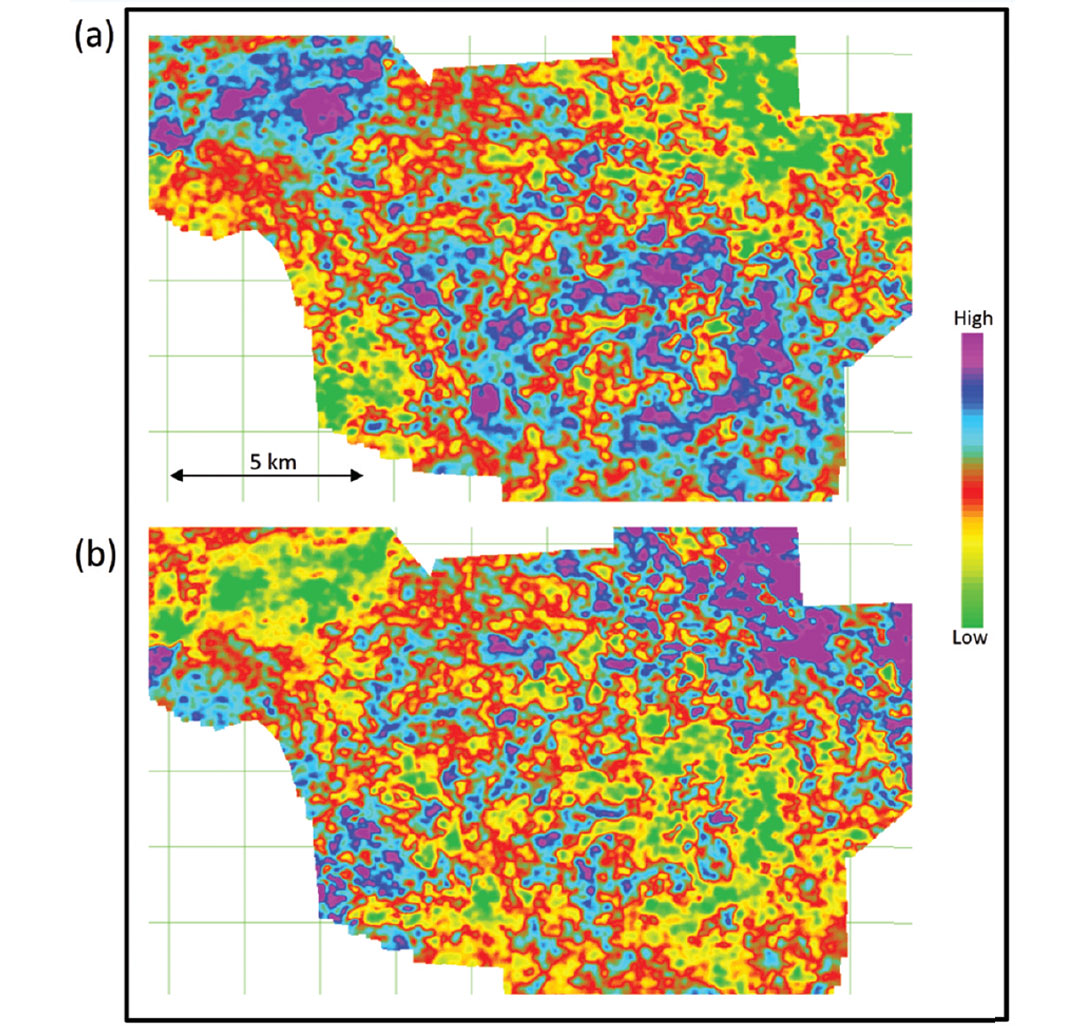
Figure 4a shows the horizon slice of LI taken at the Halfway horizon. The same horizon slice of FI is shown in Figure 4b. From the analysis carried out at well log curves, it was concluded that low LI and high FI correspond to the sandstone; with that in mind we have mapped the presence of sandstone, laterally, on these slices as indicated with the black outline. Similarly, the horizon slices of LI and FI are shown in Figures 5a and 5b, respectively, when the Halfway horizon is shifted 30 ms below. It is noticed here that the presence of sandstone disappears on these slices.
Conclusions
In conclusion, PI is very favorable attribute for sandstone reservoir characterization. Using TCCA method, we can derive two attributes of PI namely Lithology Impedance (LI) and Fluid Impedance (FI). The results on log data show that sandstone and shale can be well distinguished by LI. Also FI provides a potential pore space content identification. Integrating with geological, petrophysical, and well test data, the sandstone reservoirs can be characterized properly and new prospect can be identified directly.
Acknowledgements
We thank Arcis Seismic Solutions, TGS for allowing us to present this work.


Join the Conversation
Interested in starting, or contributing to a conversation about an article or issue of the RECORDER? Join our CSEG LinkedIn Group.
Share This Article