As the new millennium dawns, it is natural to focus on the future and what it holds for exploration geophysics. In the first of a two-part series, The Recorder looks at some exciting new research in the acquisition and processing sectors that will have an impact on the profession a decade down the road.
Acquisition
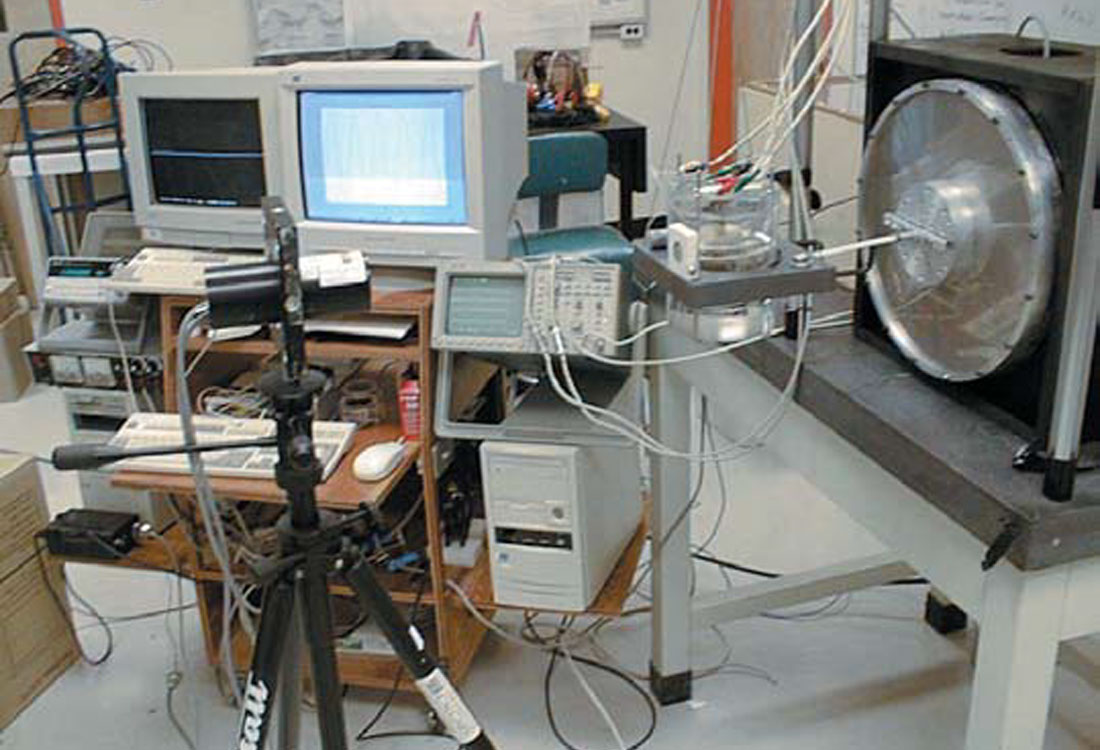
The technical lab for CREWES (Consortium for Research in Elastic Wave Exploration Seismology), is located in the basement of the Earth Sciences building at the University of Calgary.
In its 10 years of existence, CREWES has pioneered a wide range of experimental data and innovations in the fields of multicomponent acquisition, migration and AVO, but down in the lab, it’s clear that acquisition is king.
Malcolm Bertram is the senior lab technician with the University of Calgary, and works closely with CREWES. “Manufacturers of single component geophones say that they should be within at least 10 degrees of vertical, but that’s way out of spec for three-component geophones,” he says. “They should be within two degrees of level, but it’s difficult to plant and align the azimuth to those specs, and still get a good coupling.”
Bertram digs through a pile of cable until he finds a bright-red, three-component geophone. The device contains an awkward leveling device consisting of a metal bead rolling around in a plastic case, reminiscent of a child’s toy. “Try leveling and orienting one of these while maintaining good coupling,” he states. “You can degrade the quality of shear data otherwise.” He throws the geophone back into the pile. “In effect, the juggie determines the quality of your final section.”
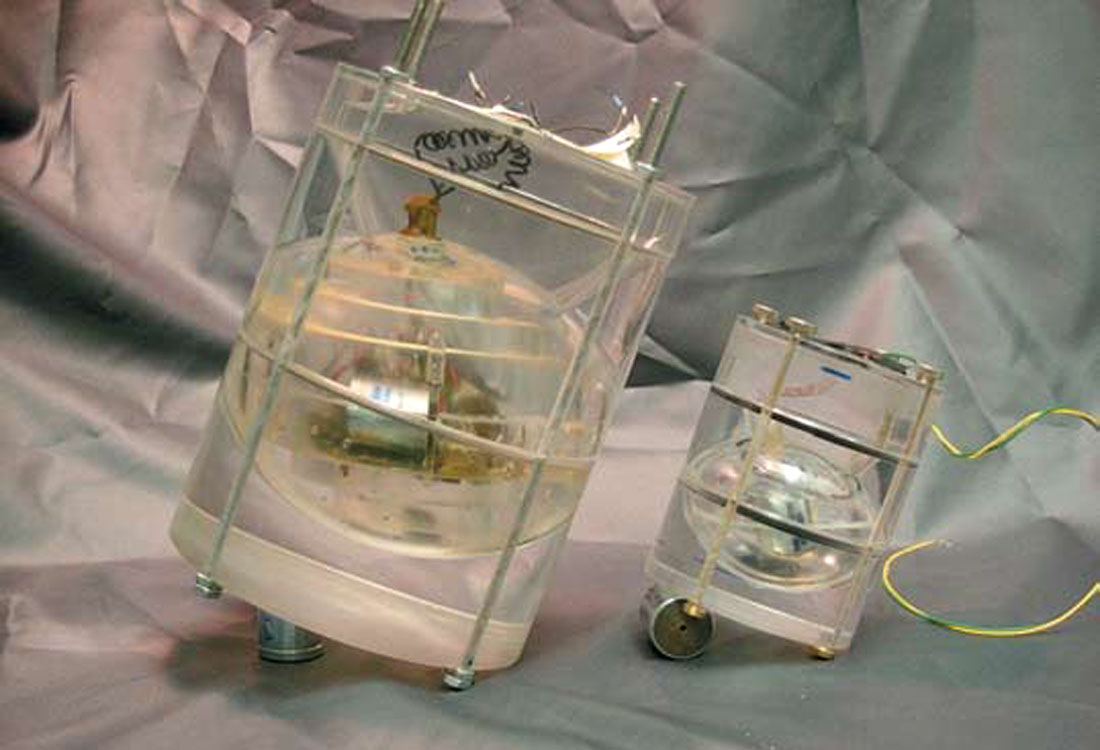
Going over to a test bench, Bertram picks up a device recently patented by the U of C. It is a clear, acrylic cylinder about the size of a large tin of fruit juice. “We call it the auto-leveling 3C geophone,” he proudly notes.
The product of over a thousand hours of research and design by Professor Robert Stewart, Bertram and fellow technician Eric Gallant, the geophone consists of three sensors mounted in a ball that floats freely in a liquid within the acrylic cylinder. “We’re ready to try out prototypes in the field now,” says Bertram. “It can automatically level the elements, even if it’s 30 degrees off vertical.”
Geophones that automatically orient themselves are especially valuable in special application projects, such as Ocean Bottom Cable. “Three component OBC acquisition has great potential because it supplies excellent converted wave data,” says Bertram. “You don’t have the land problem of near surface weathering that is destructive to the shear wave.”
But it is difficult and/or expensive to position geophones at the bottom of the ocean. “Some companies actually used robotic vehicles to plant geophones at a depth of 100 metres. It was a very tedious process every time they wanted to move the cable, however.”
Just as it is in surface work, orientation of the geophone is critical to the quality of OBC data. “Getting the azimuth isn’t bad, because it’s the direction you’re dragging the cable,” says Bertram. “But the geophone needs to be upright. That’s where our system works to automatically level itself.”
Solid-state geophones also hold great promise; IO recently unveiled its VectorSeis model at the SEG convention. “The VectorSeis doesn’t care which way you put it on the ground, it is able to detect the vertical direction from gravity, then determine the three axes of orientation,” says Bertram.
But the U of C device has an advantage in cost. “We use standard elements, so they’ll be quite cheap to manufacture. Our geophone won’t cost much more than the standard 3C geophone.”
One hurdle for the U of C geophone is finding a liquid that maintains phase stability in temperatures ranging from -50C to 50C. “Our system ‘as is’ will work well on the ocean bottom, where it is at a fixed temperature,” says Bertram.
Processing
Neural Networks
As many seismic programmers know from experience the neural network is one processing tool whose potential lies tantalizingly close, yet so far away.
Neural network software mimics the multi-path, interactive nature of the brain to process information on the basis of probabilities, rather than the yes/no, binary-type computing.
In geophysics, neural networks are used both in interpretation and processing. In processing, neural networks have been attempted for activities such as picking first breaks. The geoscientist supplies examples of first break arrival times in order to ‘teach’ the program what they ‘look’ like. The neural network computes a series of attributes using a complex series of algorithms, and then tries to apply what it has ‘learned’ by making its own picks.
Landmark Graphics Corporation uses neural networks in its ProMAX suite of seismic processing tools. “We have algorithms that attempt to automatically pick a variety of geophysical attributes such as first break arrival times, noisy and/or reversed traces, horizons, and velocity analysis semblance panels.” says Dan Grygier, product manager of seismic data processing projects for Landmark.
Grygier admits that neural network applications have not been wildly successful. “It has not worked well for velocity analysis, for instance, especially for noisy land data or any area of complex geology. Hardware really isn’t the problem; the roadblock is more related to the fact that the neural networks expect things to be very similar. In the presence of noise or rapid variations in lithology or structure, things change very rapidly and unpredictably, making it difficult for the programs to find adequate similarities to make accurate estimates.”
Over the next decade, Grygier predicts a good news/bad news scenario for neural networks. “There is opportunity for the sophistication of algorithms to increase dramatically and adequate hardware on which to run the programs should be readily available, but it is probable that the noise problem will worsen. With the growing popularity of multi-component data sets, we will see more converted shear data with a much lower signal/noise ratio than the conventional P-wave data.”
AVO – Lambda, Mu, Rho
Bill Goodway is a geophysical advisor at PanCanadian. Over the last few years, he and his peers in Calgary and around the world have been working with Amplitude Variations with Offset, or AVO, to derive more meaningful petrophysical attributes from seismic reflections.
“Traditional AVO and petrophysical analysis exploit variations between compressional and shear velocities for fluid and lithology identification,” he notes. “However, in our approach, by considering the underlying physics involved in seismic wave propagation, we try to estimate density and module in order to classify various lithologies and their reservoir fluid properties.”
By converting compressional and shear velocity measurements to orthogonal Lamè parameters Lambda (incompressibility) and Mu (rigidity), geoscientists can gain new insight by inverting seismic data into these intuitive rock property parameters.
Mu is the rock matrix or fabric indicator. Consolidated sand is rigid, with a high Mu value. Shale, on the other hand, is fissile or non-rigid, and has a low Mu value.
Lambda refers to incompressibility, and is a pore-fluid indicator. A perfect liquid is incompressible (i.e. a high Lambda value), whereas a gassy pore fluid is highly compressible (i.e. a low Lambda value).
Using standard seismic inversions, Lambda, Mu and Rho (density) can be robustly estimated, to give LambdaRho and MuRho attributes.
“LambdaRho is the most sensitive indicator of water vs gas or oil saturation,” says Goodway. “MuRho can be used to help identify pure rock fabric or lithology.”
Geoscientists can combine the LambdaRho and MuRho values in 2D cross-plots and with sonic log calibration to make exploration inferences regarding different lithologies, such as shale, sandy shale and sand.
“We have had success where there is little or no knowledge of lithologies,” says Goodway. “We’ve used it in the North Sea, the Gulf of Mexico and (offshore) West Africa, where two significant oil discoveries in Tertiary clastics were identified.”
According to Goodway, accurate extraction of Lambda, Mu and Rho from seismic data in areas with complex structure is the Holy Grail for researchers. “In the future, we’ll be able to break Rho out, giving three fundamentally orthogonal measurements of Lambda, Mu and Rho.”
A third decree of freedom would make a big difference, says Goodway. “We wouldn’t be confused by highly porous, gassy oil versus lower porosity gas, for instance. For example, on the Mu axis, we could break out sand, silt and shale clusters. Then, on the Lambda vs Mu plane – in the right lithological cluster – we would see the impact of fluids. Finally, on the density axis, we would see porosity.”
One major drawback, admits Goodway, is the difficulty of obtaining shear data. “We have been working with compressional waves to infer shear measurements from AVO, but there is a debate on whether these estimates are meaningful. We have tried to acquire pure shear waves, but it is very expensive, and has the risk of being totally unusable because of poor data quality.”
Migration
While migration has traditionally focused on the two-dimensional issue of restoring the reflection of a seismic wave on a dipping target to its correct position, Professor Larry Lines and other academics are busy researching applications in three-dimensions.
“Given today’s increased computing capabilities, 3D pre-stack migration is feasible,” says the chair of exploration at the University of Calgary. “Researchers are also examining imaging methods that account for the fact that seismic velocities vary with the direction of wave propagation. Migration can be used to account for anisotropic properties of rock, or the velocity variation with direction.”
Velocity variations in rock can arise due to layering or nonhomogenous properties, such as a north-south fracture pattern created by structural deformation. The effect of anisotropy on a seismic image is to systematically distort the true location of reflectors.
One method that researchers are using to solve for anisotropic migration is by using ‘movies’ to fine-tune velocity parameters. A movie is a series of processed seismic sections in which velocity parameters are experimentally altered to create a subtly-evolving sequence. “Velocity analysis and migration are closely coupled,” says Lines. “You find the best movie that’s focused.”
Until recently, creating movies was a time-consuming, cumbersome process. “I was doing some processing of marine 3D data at Hibernia, and it took one Sun workstation one-and-a-half weeks,” says Lines.
Fortunately, recent advances in programming have made the movie technique much more practical. “A programmer at the U of C wrote me some code in parallel computing,” says Lines. “It now allows us to solve computationally intensive problems by using an array of processors to compute simultaneously. It reduced the Hibernia run time to two hours. That’s hundreds of times faster.”
The process will allow much better resolution in complex structural areas with problem lithologies, like shales. “Ten years down the road, we’ll have faster programs and better migration velocity analysis. I foresee the development of a data base to allow us to migrate steeply dipping shales in the Foothills.”
As barriers to complex processing procedures are lowered, the focus will shift back to acquisition. “You still need good data,” says Lines. “We’ll see more multi-component geophones used to get a complete picture of elastic waves. We’ll do more with discriminating lithologies.”
Lines also predicts that depth migration will become a common procedure. “We typically do time, because recording and processing are done in the time domain, but drilling is done in depth. When you do depth migration, you can handle lateral velocity variations. I don’t see any reason why one shouldn’t do both time and depth migrations.”
And Beyond...
“About four or five years ago, there was an article in Scientific American about passive sonar imaging, in which they used waves on the surface as the ambient source,” recalls Jim Laing, a seismic processor and programmer at Apoterra Seismic Processing Ltd.
Laing, who envisions pie-in-the-sky seismic systems as a hobby, was intrigued.
“I realized we could do something similar with seismic. In built-up areas, car traffic and other man-made noise contaminates the seismic signal; what if we used the contamination as the signal, however?”
Laing’s system, which he calls passive seismic imaging, or PSI, would require an innovative gathering device. “It would be a self-contained sensor with a transmitter to send data real-time. You could use the transmitter to locate the geophones.”
One potential use for PSI is in oilfield monitoring for steam injection. “4D seismic is just repeated 3D, but with PSI, you could do continuous imaging,” says Laing. “You have a built-in source of noise with the pumps.”
A major problem with PSI is the source of ambient noise. “Most seismic work in Alberta is done in the 10-80 Hz range,” he notes. “Ambient noise from natural sources, like earthquakes, is in the .01 to 10 Hz range. But wind noise, which is broad-band, might be more useful.”
Another hurdle is that the hardware for PSI currently doesn’t exist. “You could probably take existing components and reconfigure them,” says Laing. “Solid state geophones are already happening, they’re coming off the lab bench.”
The biggest drawback, however, is the processing package, or lack thereof. “Because the information is in real-time, the software would have to be configured with running windows on the input and correlations on channel-to-channel.”
On the other hand, all that PSI would take to develop is time – and a lot of money. “If you’ve got $10 million, then I’m your man,” he jokes.


Join the Conversation
Interested in starting, or contributing to a conversation about an article or issue of the RECORDER? Join our CSEG LinkedIn Group.
Share This Article