Introduction
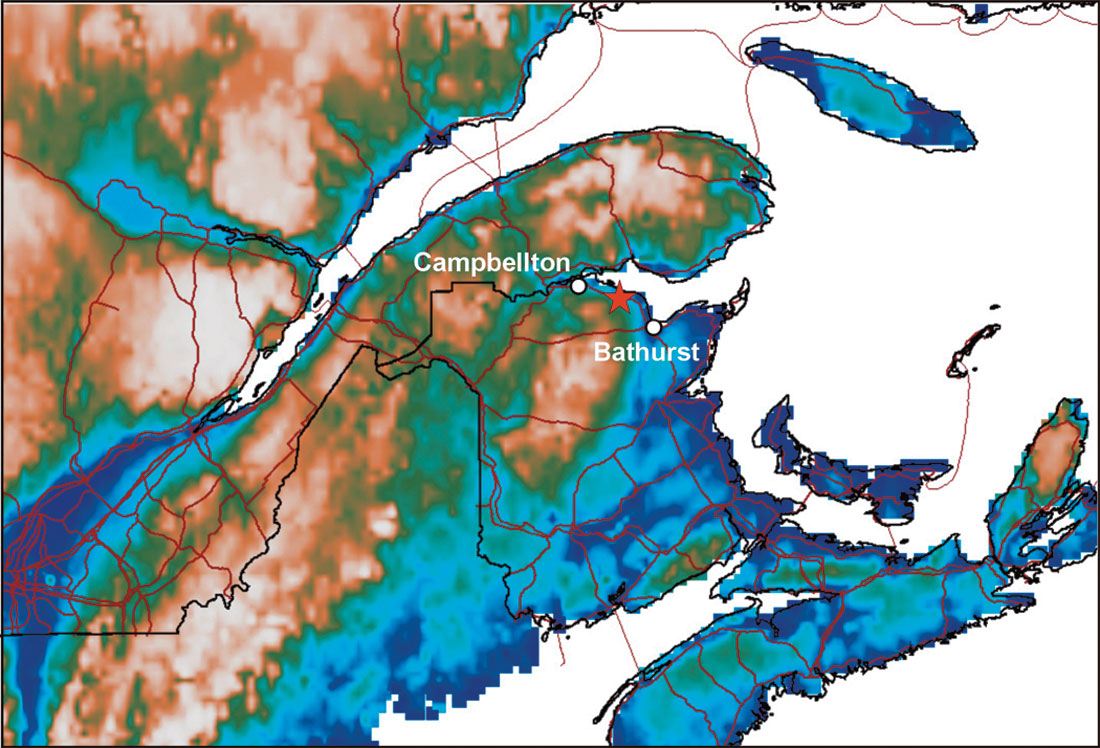
Properly constraining the shape and size of an orebody requires a complete database of geophysical and geological information derived from both surface and borehole data; each dataset provides a means of outlining the relevant changes in physical properties in either one or two dimensions. In this paper we present the results of one such integrated study to delineate the Nash Creek Zn-Pb-Ag deposit, New Brunswick (Figure 1), using geological and petrophysical borehole logs, borehole electric and ground gravity data. The Nash Creek deposit is located along the western margin of the Jacquet River Graben in northeastern New Brunswick (Dostal et al., 1989). The deposits in New Brunswick are a sub-group of seafloor hydrothermal deposits hosted by sedimentary and volcanic rocks in continental back-arc rifts (Goodfellow, 2002). Sulphide mineralization occurs as stratabound and laterally continuous zones of matrix filling or replacement style mineralization, as fracture fill within flow or pyroclastic units, and as discrete breccia zones. At Nash Creek, high-grade sulphides (high density, good conductors) are imbedded in laterally extensive alteration envelopes (low density, moderate conductors).
Despite more than 50 years of exploration by the drill bit, resulting in 3.4 Mt indicated resource estimate (5% Zn, 0.8% Pb, 30.9 g/t Ag)*, little is known about the petrophysical properties of sulphides, alteration zones and hostrocks . Ground geophysical data (gravity and magnetics) from federal and provincial databases are sparse at best. Thus a geophysical exploration program was designed to map the shallow mineralization at Nash Creek. First, a comprehensive petrophysical database was built to provide the necessary background information for the geophysical data acquisition program. Additional regional gravity stations were added to provide the framework for the high-resolution gravity survey. Borehole multi-electrode arrays were deployed to obtain in situ bulk resistivities of sulphides and alteration zones. Then, follow-up electrical borehole-to-borehole measurements were used to establish lateral continuity of shallow mineralization between boreholes. Finally, a high-resolution gravity dataset (in combination with borehole data) was used to constrain the shape and size of near- surface massive sulphides.
* Mineral resource estimate compliant with NI 43-101.
Petrophysical Data
One of the advantages of this study was the large number of boreholes and core available for the area. The core provided a means of assessing the bulk physical properties of the rocks at Nash Creek, and thus determine what types of geophysical surveys would be most useful in constraining the size and location of any sulphide deposits. Density measurements were collected on samples from seven boreholes within the area, and magnetic susceptibility in two boreholes; reliable electrical conductivity measurements on the other hand were difficult to obtain on the often highly weathered core samples.
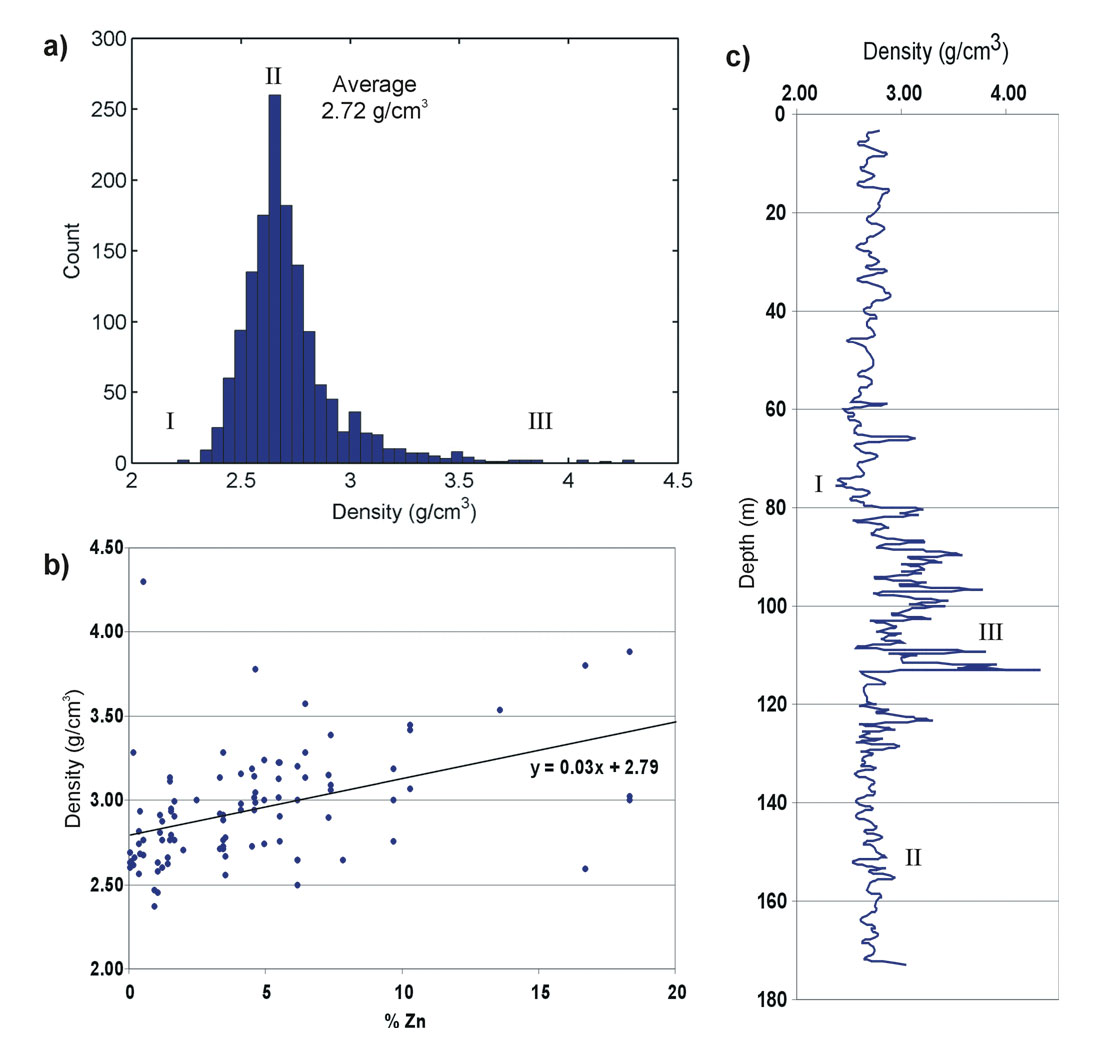
Magnetic susceptibility measurements sampled at 0.2 m along the boreholes indicate elevated values in mineralized zones containing 1-15% sulphides (sphalerite, pyrite and galena), however basaltic and mafic tuff units also appear highly magnetic. Magnetic mapping in this area will likely show anomalies in response to all of these units, and although it may help in delineating ore-bearing structure, it may not reveal much useful information concerning the ore deposits themselves. The 1443 density measurements (Figure 2), sampled at an average 1 m in each of the seven boreholes scattered throughout the study area, show an average density of 2.72 g/cm3 and a median density of 2.68 g/cm3. The low and high tails of the density distribution (Figure 2a) correlate well with core lithologies: alteration zones are characterized by low densities (zone I), and high densities correlate with Zn-rich mineralization (> 3.0 g/cm3) (zone III). At Nash Creek, density logs often reveal a broad alteration and mineralization envelope (Figure 2c). In addition, a slight trend of increasing density with zinc content (Figure 2b) is observable in some of the logs, with an intercept approaching the average density value of 2.72 g/cm3.
Gravity data
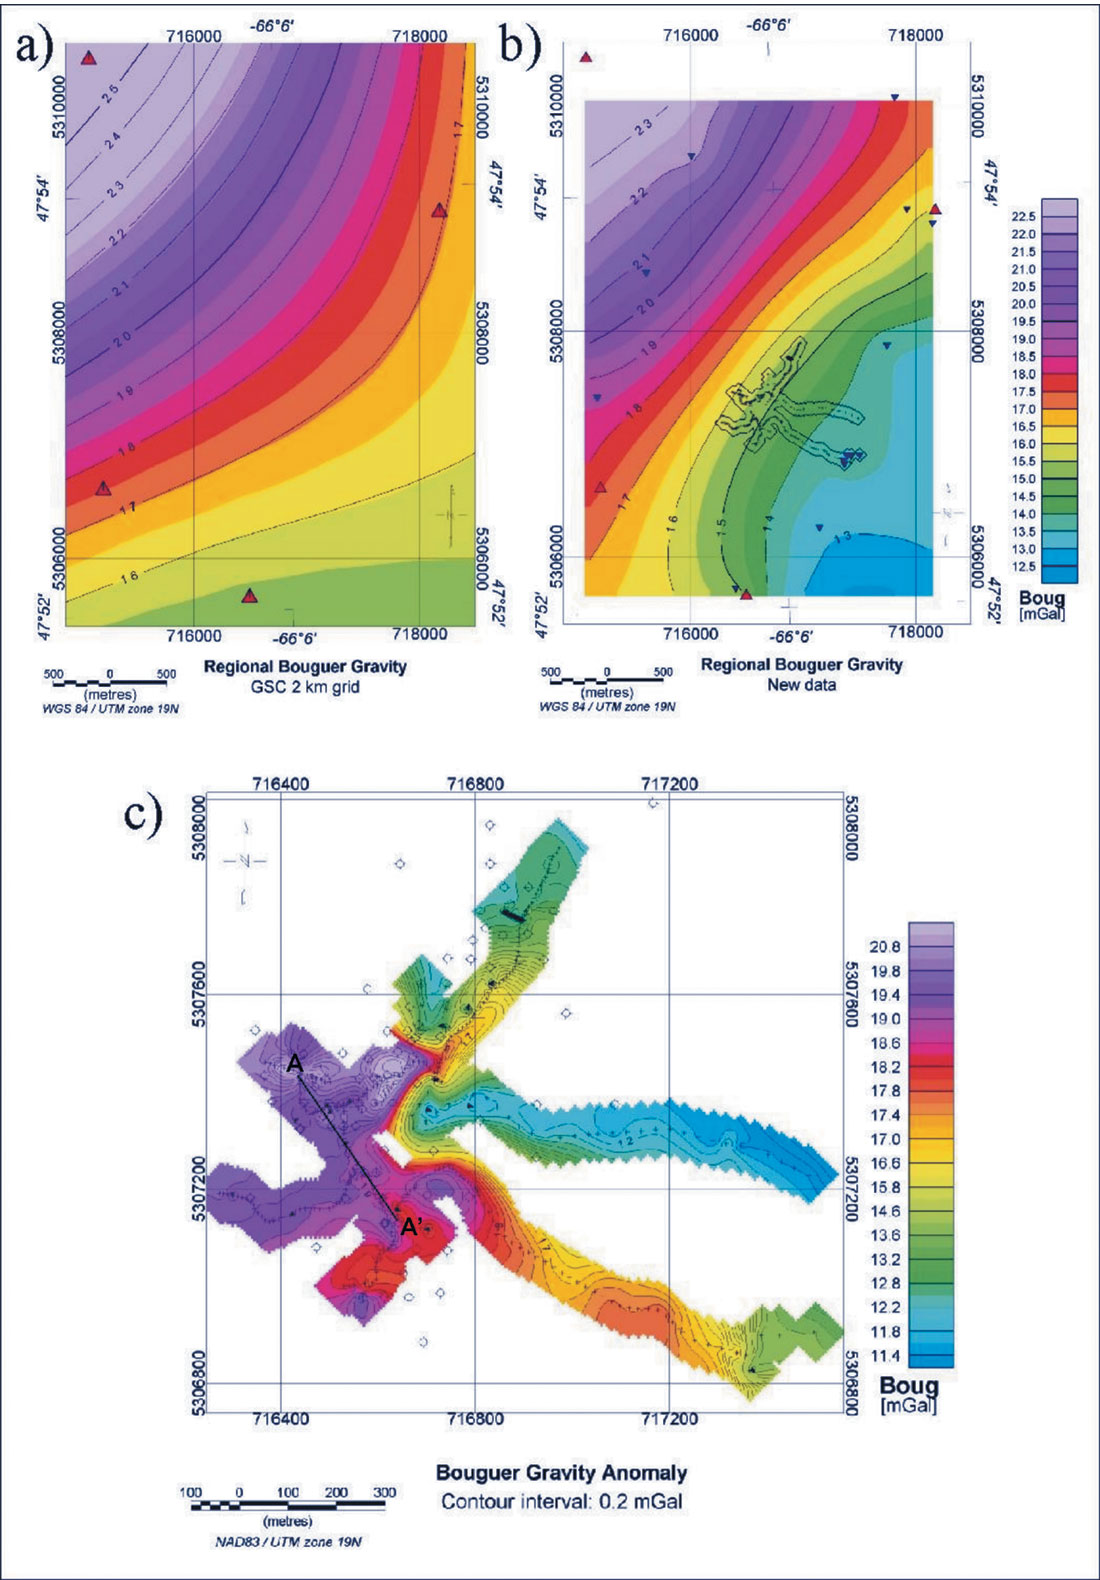
Petrophysical results suggested that a ground gravity survey might be useful in delineating the extent of the mineralized zone; hence 451 new stations were collected during the summer of 2006 (Figure 3). Acquisition was done with a Scintrex CG-5 gravimeter, and positioning with a Thales ProMark3 DGPS system. The resolution of the DGPS was limited by the forest cover in most of the study area, resulting in a horizontal resolution varying from 0.01 m in open areas to 2-3 m in densely forested areas. Four pre-existing gravity stations from the Geological Survey of Canada (GSC) (Figure 3a) were tied into 11 new “regional-scale” stations spaced ~1 km apart (Figure 3b). In the survey area, stations were collected every 10 m over the suspected mineralization, and 20-30 m in the surrounding areas (Figure 3c). In addition, 55 stations sampled every 2 m were collected in a rectangle covering a 180 m2 area over known shallow mineralization. Station elevations were constrained by the DGPS survey and a detailed digital elevation model (DEM) from the government of New Brunswick (Service New Brunswick), with a resolution of 1.0 m on the horizontal and 0.1 m on the vertical. A borehole database was used to provide extra positioning constraints in those areas of the survey that were heavily covered by forest. Gravity data reduction was accomplished by standard procedures: drift, latitude and free-air corrections led to the Free Air gravity anomaly. A density of 2.726 g/cm3 was used for the Bouguer correction. Finally, A a minimum curvature algorithm was used to create the final grid with a 5 m cell size (Figure 3c).
Resistivity data
At Nash Creek, wide spread brecciation and alteration zones (often associated with a pyriterich matrix) pose a problem for conventional airborne electromagnetic exploration methods. Therefore as a supplement to the gravity data, several single borehole vertical resistivity profiles (VRP), borehole- to- borehole, and borehole-to-surface resistivity tomography (BRT) datasets were collected over the Nash Creek deposit (Qian et al., 2007) in the hopes of constraining zones of high and low resistivity. When a constant injection voltage is applied between electrodes across two boreholes, the electric current flow depends on the contact resistances of each of the electrodes and the rock formation resistance between them. If the borehole is water filled, we can assume the contact resistance is uniform. Thus the electric current from the positive current electrode to the negative electrode maps the rock formation resistance between the two points. At Nash Creek, the boreholes were water filled and borehole to borehole separation varied from 40 m to 180 m. The multichannel borehole DC resistivity data acquisition system was developed by Geoserve in Germany for near surface archaeological and hydrological applications. The borehole cable design allows a seamless integration of borehole and surface measurements: each cable has 24 electrodes which may act as either a source or receiver, with or without simultaneous readings from surface electrodes. The system has the capacity to acquire more than one thousand resistance readings per hour.
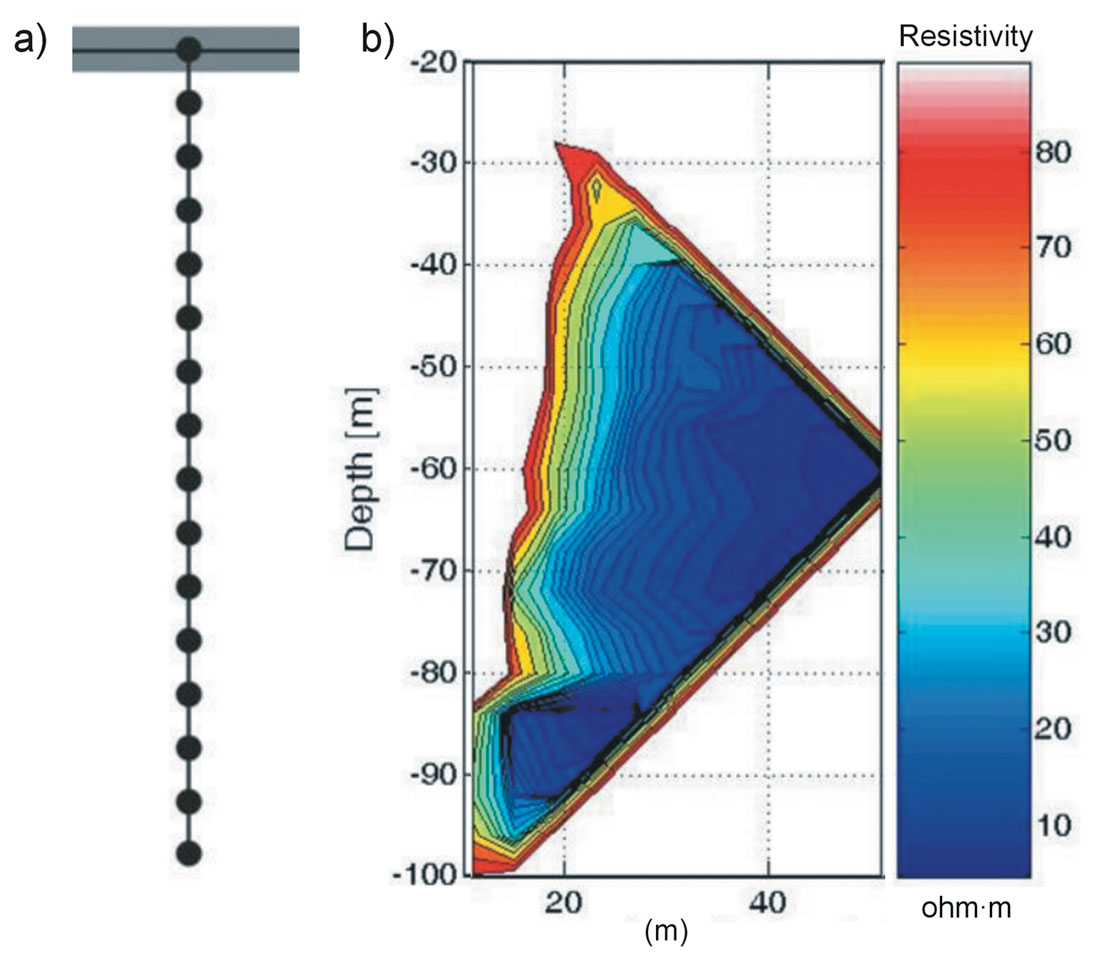
From the electrode array in a single borehole, we performed a Vertical Resistivity Profile (VRP), in which the current and potential electrode setup is the same as a surface Schlumberger survey (Figure 4a). The measured voltages are converted into apparent resistivity through a geometry factor, which takes into account the earth-air surface (Qian et al., 2007). An example pseudo-section is shown in Figure 4b, in which we can clearly identify the sulphide zone with a resistivity of less than 15 ohm·m. This zone is located between the depths of 82 and 97 m and its lateral extension is more than 40 m. From the measurements in a single borehole however, we can not determine the azimuth (direction) of this extension; surface electrode lines or multiple borehole electrode data acquisition systems must be deployed for the determination of the azimuth.
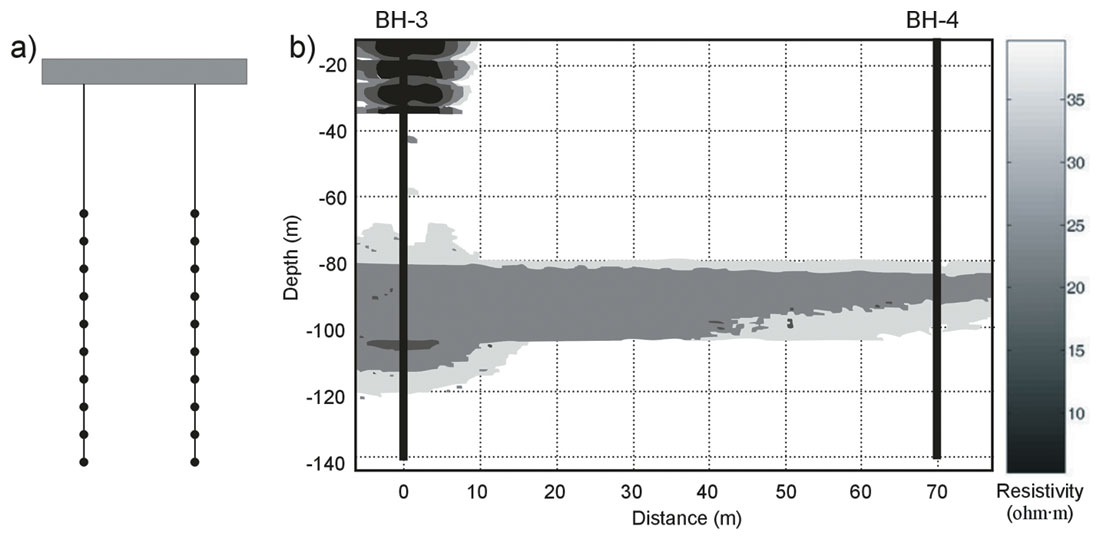
With the data from two or more boreholes, we can construct a cross- borehole resistivity tomography (BRT) model by applying the following steps: (1) use a VRP pseudo-section to build a starting model at the two borehole locations; (2) perform inversion on the VRP data only (use the starting model to constrain the inversion, no smoothness stabilization applied); (3) build a starting model between the two boreholes using the two resistivity inversion models derived from the VRP data; (4) constrain the near borehole resistivities and let the tomography inversion adjust the resistivities in the central region; and finally (5) fine tune the tomography inversion model with geological/petrophysical constraints. The BRT shown in Figure 5 indicates continuity of the conductive massive sulphide zone (<15 ohm·m) between the two boreholes. The second, shallow conductive zone is restricted to the immediate vicinity of borehole BH-3.
Data Integration
Single borehole VRP data can detect and map conductive zones within a 30 m radius around the borehole; these measurements also provide an independent estimate of bulk resistivity for the calibration/ interpretation of other airborne or borehole EM datasets. At Nash Creek, alteration zones with no significant Zn mineralization or pyrite content exhibit resistivities larger than 40 ohm·m and have average densities; breccia zones with pyriterich matrices and less than 1% Zn exhibit resistivities between 15 and 40 ohm·m and average (and often lower) densities; strong brecciation with more than 5% Zn content exhibits in situ resistivities of less than 15 ohm·m and elevated densities (> 3.2 g/cc).
Given the extensive petrophysical and geophysical datasets, a simple 2D model was developed that integrates the borehole electric data, borehole density, geology and gravity data (Figure 6). The final model (located along the black line in Figure 3c) supports a NW to SE dipping thin sheet type mineralized zone with density values of 3.2 g/cm3; it is 20-30 m thick over most of the area, except on the SE border, where a ~60 m thick body was modelled. A shallower mineralized zone is observed between boreholes BH-2 and BH-3. The mineralized zone at 80-100 m between boreholes BH-3 and BH-4 is very well constrained by borehole electric data (see Figure 5), while this same data indicates a shallow conductive zone close to BH-3 but not intersecting the borehole. Density logs in three boreholes show higher than background values in the modelled sulphide zones. This 2D model does not include deeper zones of mineralization (>150 m), overburden thickness variations along AA’, or possible 3D effects such as strike and dip of key lithological units.
Conclusion
The integrated geophysical study enabled us to produce a 2D model of the shallow mineralized zone in the Nash Creek area. Although this model is only one of many possible solutions, it is supported by petrophysical measurements in three intersecting boreholes, geological information through all boreholes, the surface gravity data as well as borehole electric data in three of the boreholes. In the future, cross-plots of readily available assay data with petrophysical measurements from core and downhole logs may form the basis for building 3D geophysical models of massive sulphide deposits.

Acknowledgements
Funding for the borehole geophysical data acquisition program was provided by a research grant from Slam Exploration. We would like to thank Slam Exploration (www.slamexploration.com) for permission to work on the Nash Creek property and to present the results, Geoserve (www.geoserve.de) for the borehole electric survey equipment and Scintrex (www.scintrexltd.com) for use of the gravimeter.


Join the Conversation
Interested in starting, or contributing to a conversation about an article or issue of the RECORDER? Join our CSEG LinkedIn Group.
Share This Article