How does a large independent oil company leap into technology and methodology that are relatively new to the industry, and certainly new to the company in question? Having never worked with multi-component seismic acquisition and processing, Apache Corp. decided in 2004 that the time was right for the company to evaluate the value of multi-component data to better improve their understanding of geophysical problems.
As a first step, the company looked at the many geologic settings and geophysical problems in its worldwide portfolio of prospects and made a short list of problems/projects where (at least in theory) it was possible that shear wave information through mode conversion may lead to a better understanding of reservoir. These projects included fractured reservoirs, lithology determination, gas shadow problems and other issues where multi-component data may aid our understanding.
As a result of this study, three projects were identified where it was determined (through a significant modeling stage) that information from multi-component data may help. Each of these projects addressed different geologic settings and different geophysical problems. This paper examines the results of one of these studies, where the objective was to gain a better understanding of the lithology contained in channel sands associated with production in an area of Alberta.
The project is located in East Central Alberta. The target formation is the Rex Member of the Mannville Fm. The Rex is predominantly a fluvial system where coals are an issue due to strong reflectivity. In particular, the target sand lies immediately below a relatively thick coal (4 meters). The target sands themselves are 4 to 10 meters thick. Channel systems in the project area are 200 to 300 meters in width. Depth to target is approximately 1000 meters, with successful wells testing over 1.0 mmcf per day. Switching unit systems, reserves are about 0.7 Bcf per well. With D&A costs running at about $170,000, an economic project can be developed if success rates are reasonably high.
A simple geologic model assuming that differential compaction of the different lithologies in the channel system results in positive structure (drape) of the overlying Rex coal was used for the initial wells. This channel model appears to be simplistic. Simple diagrams of channel systems do not reflect the true complexity of channel systems. Figure 1, taken from NASA’s old Geomorphology from Space website, illustrates a present day analogue.
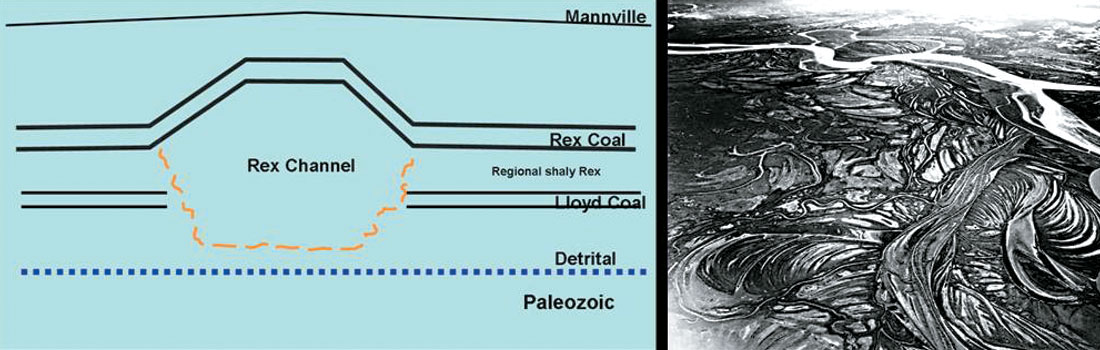
Figure 2 illustrates the problems inherent with a simple structural model pursued using P-wave data. Two well locations are illustrated on features with similar structural characteristics but the first well was plugged with no hydrocarbon production while the second is an excellent gas well. Thus, drilling structural expressions found on the P-wave data does not necessarily lead to successful wells.
Similarly, amplitude information on the P-wave data does not necessarily lead to determination of successful well locations. Well data was also examined as part of the modeling process to justify the multi-component data acquisition.
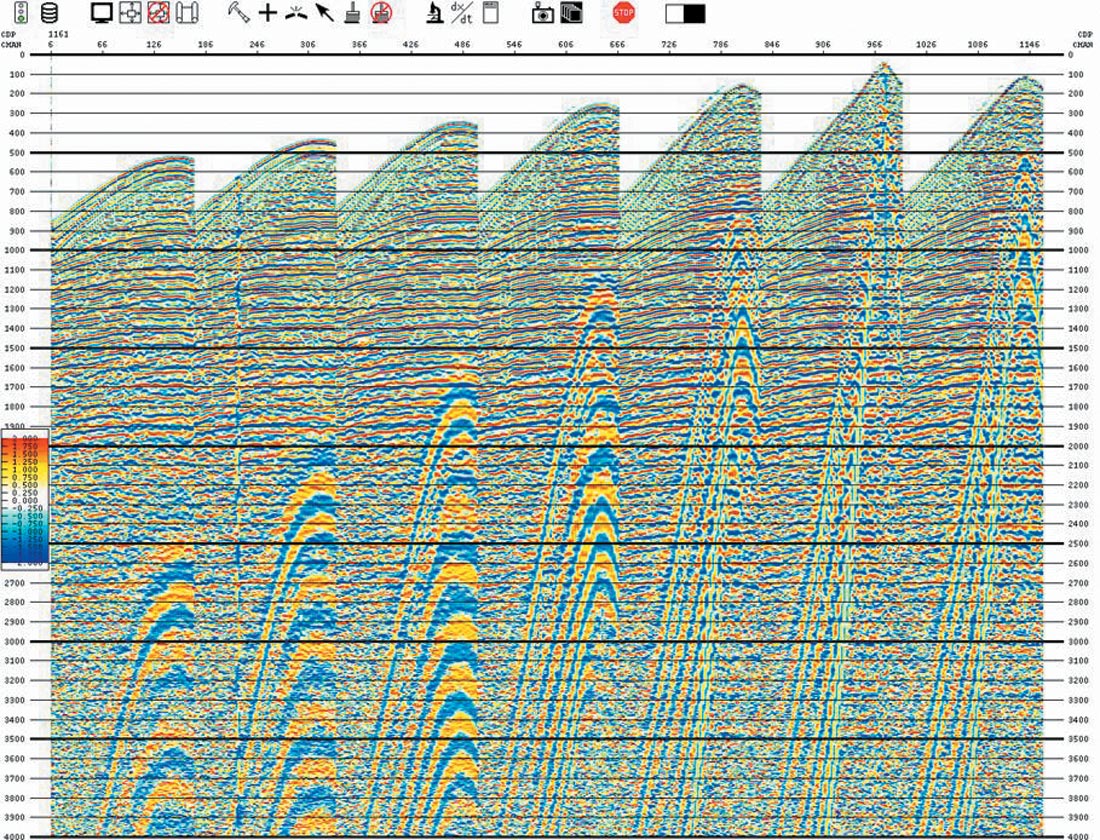
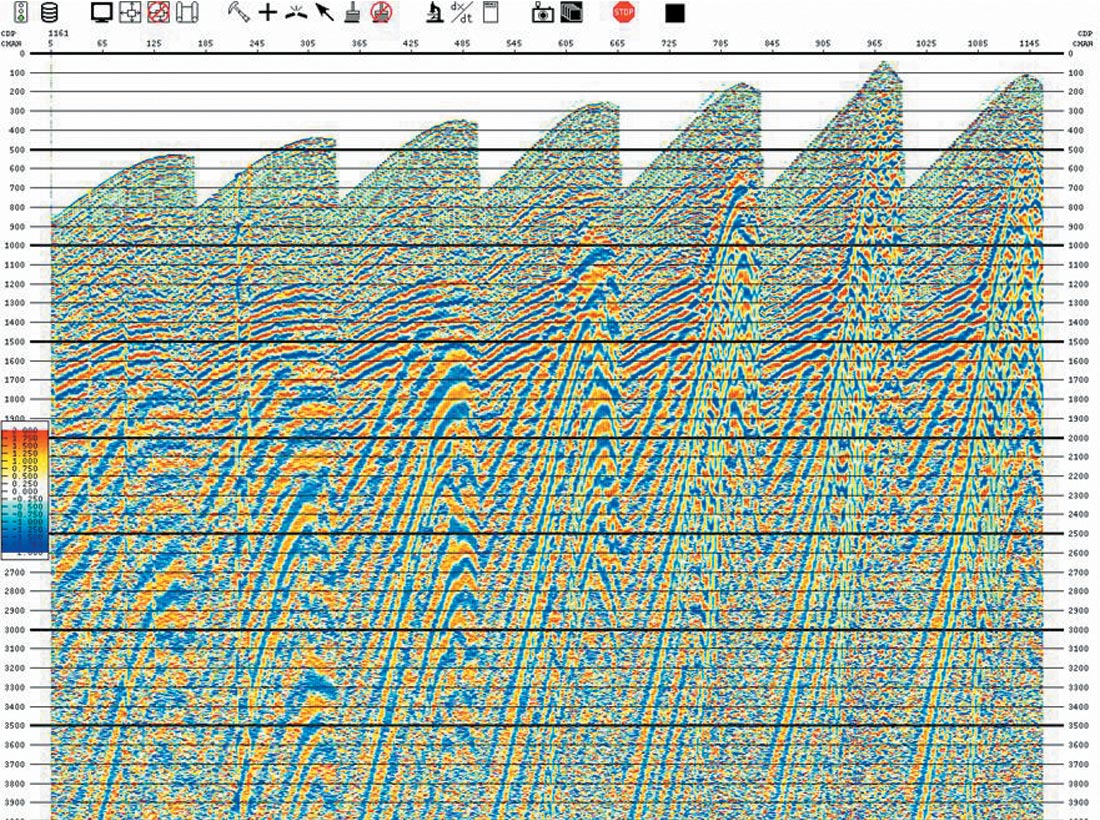
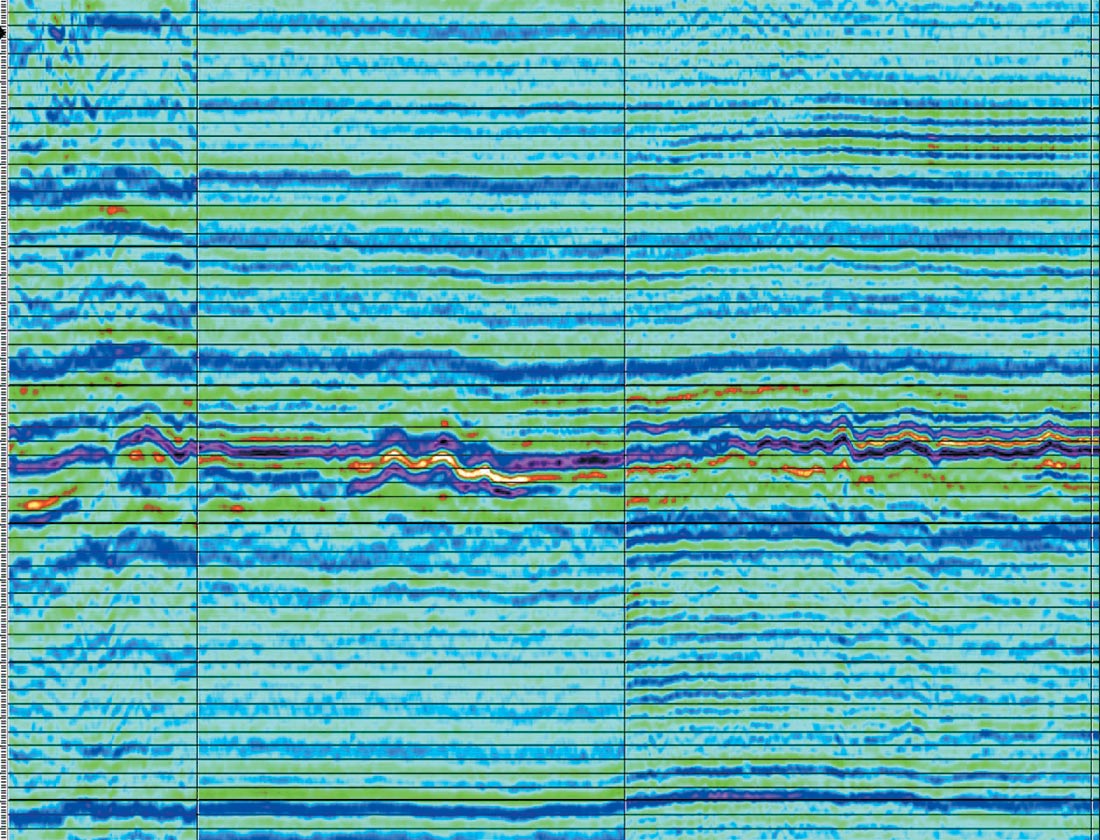
Initial survey planning involved assessment of operational issues and existing understanding of geophysics and geology in the area. In each of the projects lack of experience in multicomponent acquisition led to a “Rolls Royce” approach to shooting the seismic data the first time. It was the intent that the data be used to assess what would really be needed in the future to achieve reasonable results. The result was that data was generally “overshot” compared to what would have been acquired for conventional P-wave data. The project area of East Central Alberta is characterized seismically as having generally high quality conventional land seismic data. It may perhaps be expected that if seismic techniques don’t work here then they won’t work anywhere. As an example, Figure 3 shows a raw shot record from the field. This data is the vertical sensor component of single sensor acquisition so there is no attenuation of noise in the field through the deployment of arrays. The record shows very clear ground roll, which is extremely well defined and does not necessarily lead to problems in processing. The P-wave reflections for the channels associated with the Rex coal are at approximately 800 msec. and can be clearly seen in these raw data.
Given the quality of the raw data and that the design objectives of the survey were to do the best job possible, it should be expected that excellent seismic volumes could be produced. To this end the survey was shot with dynamite (single hole) and with very high fold. Maximum offsets were longer than required for imaging of the shallow target on the P-wave data but modeling had suggested longer offsets would be beneficial for the mode-converted data. Recording parameters were:
- Receiver interval: 30 m.
- Receiver line interval: 210 m.
- Shot interval: 42.43 m; Single hole dynamite.
- Shot line interval: 240 m.
- Patch: 12 x 94 live receivers.
- Shot on diagonal. Patch moves for every shot.
- Total survey shots: 11174.
- Total survey receivers: 11255.
- Nominal fold (30m x 30m bins): 140.
- Survey max offset: 2060 m.
The shooting template is roughly square, yielding a very good azimuth distribution for the survey, which was shot as a “shoot 1 / roll 1” template. All azimuths are represented out to an offset of 1,300m.
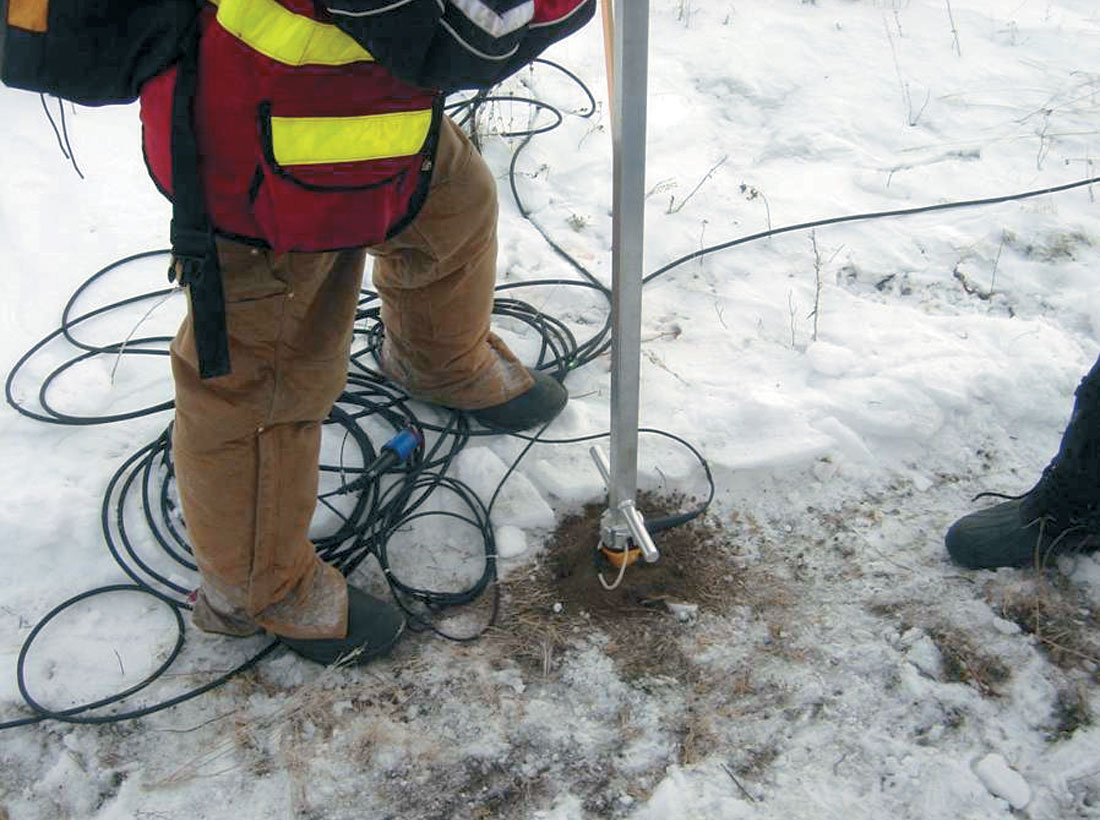
Note that little expense was spared in this acquisition, and the number of shots is almost equivalent to the number of receivers. The fold (140) is perhaps excessive given the apparent S/N of raw data and the conventional nature of the target. It is worth noting that similar redundancy is employed in multi-component seismic work being done for heavy oil applications. It should also be re-stated that our intent was to examine, through decimation of this data set, what effort would be appropriately efficient in the future. The surface conditions in the area permitted receivers to be deployed pretty much on a regular grid with few deviations. Some shots were relocated in areas of frozen lakes. Figure 4 shows the field deployment of receivers.
Good P-wave data does not necessarily mean that the mode-converted data will be good as well but in this case even the data on the raw horizontal receivers looked good. There appears to be well defined (but limited) ground roll, which has properties consistent with what might be expected on the horizontal component (note that the extent of the noise cone is shallower in time at longer offsets when compared to the ground roll on the vertical component). Additionally, note that there are apparent mode conversion arrivals on the raw horizontal component which do in fact correspond to the target level (see Figure 5).
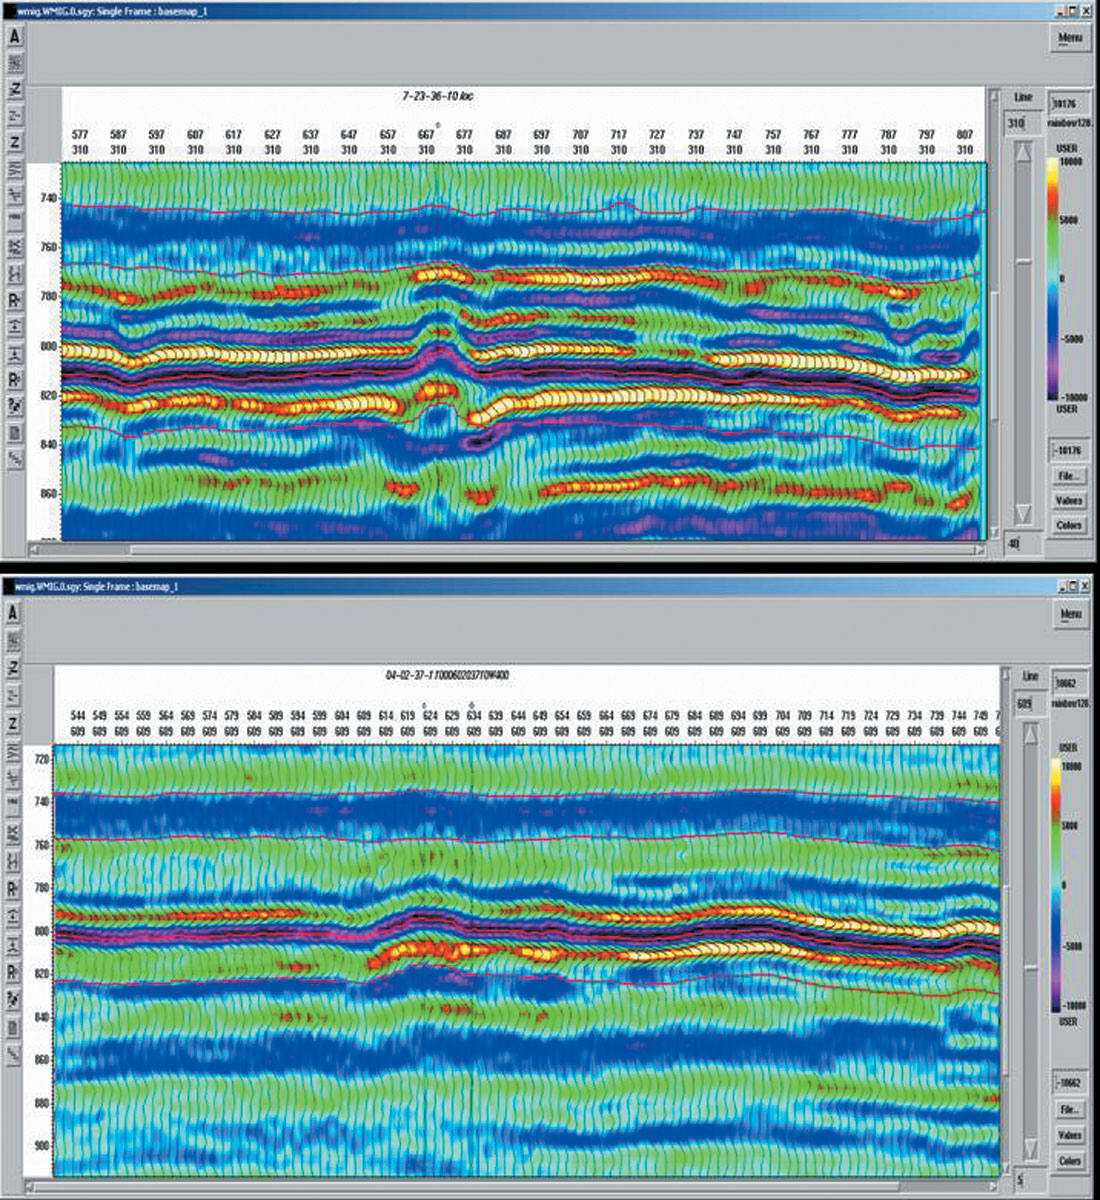
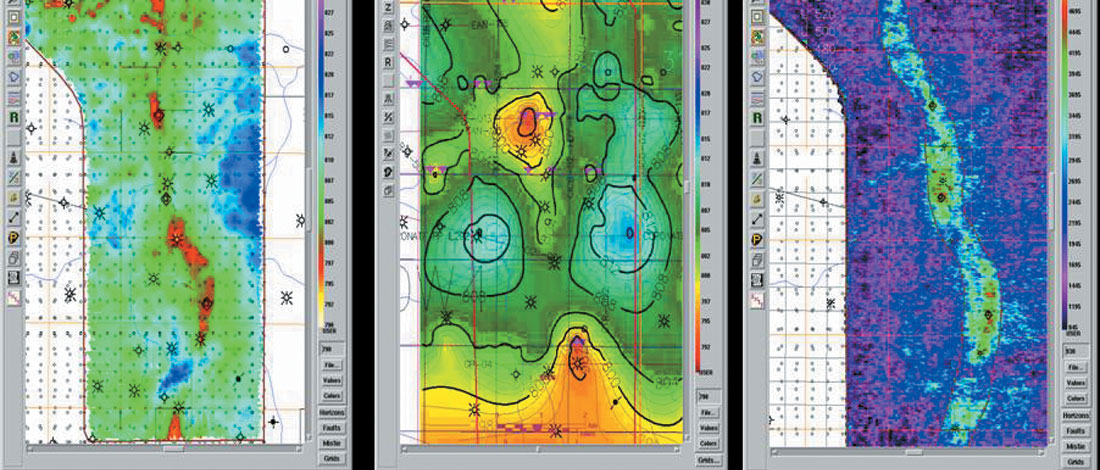
Given the quality of the raw shot records, it is not surprising that reasonable quality PP and PS wave sections were achieved. Initial PP and PS registration can be achieved by picking the Rex Coal event. However, note that a multi-component VSP had also been recorded, which allowed registration at different levels in the data. The initial benefit of 3D vs. the 2D data in the area was immediately apparent, as mapping of the target channel on the P-wave data was relatively easy. Figure 6 shows a time structure map at the Rex Coal which clearly identifies the location of the channel. However, amplitude maps on the P-wave data do not necessarily help in lithology determination. Initial structural maps on the PS data did not conform to structure indicated on the PP data, which led to a separate reprocessing exercise before structural conformity (or at least similarity) was achieved for the Rex Coal on both data sets. Interpretation of the amplitude information on the mode-converted data is now possible and is found to highlight features in the channel.
Critical processing issues
As part of the overall exercise in gaining experience in multi component seismic, Apache selected different processing contractors to process each of the projects. Additionally, the East Central Alberta project was processed by two different contractors in parallel. The general perception gained by this experience is that all contractors are still working to develop the right tools for processing mode converted data, and none currently has all the answers. Registration of PP and PS data is an obvious problem but other key issues include separation of P-wave arrivals from the PS and the large magnitude of shear-wave statics.
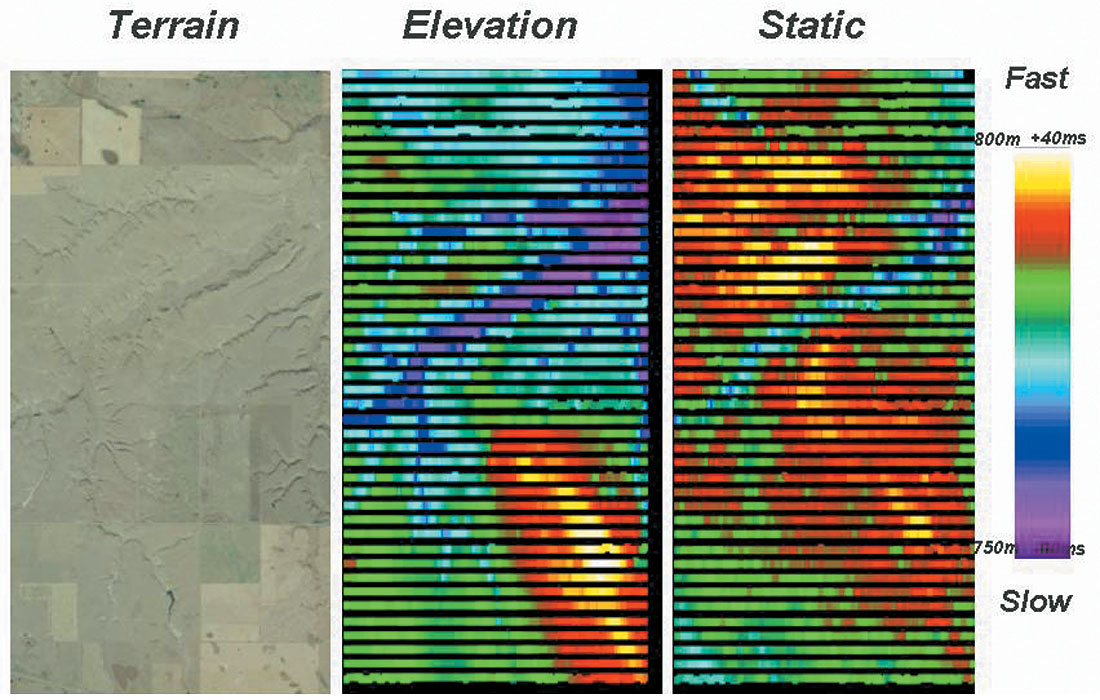
Despite relatively easy terrain and elevation variations of only a few 10’s of meters, the shear-wave statics, as expected in the WCSB, were very large and varied by 130 msec (Figure 7).
Given the acquisition method, it was anticipated that the data at the target level would contain very high frequencies. Initial results suggested that even the PP data did not contain the frequencies expected, with bandwidth significantly less than 100 Hz. Given the acquisition methodology and general S/N in the area, better bandwidth was anticipated. In fact, processing by a Canadian contractor resulted in a bandwidth improvement of about 30 Hz.
After reprocessing by a second contractor, several “issues” were resolved. The short wavelength structure is now apparent in both the PP and the PS data and bandwidth of the PP data is now closer to anticipated.
Several wells were drilled based on the results from both the PP and PS data of the first survey, and these proved to be successful. The “experiment” was expanded through acquisition of a subsequent overlapping and adjacent survey, where we tried to apply some of the lessons of the first survey.
The initial survey was generally considered to have been “successful” but “expensive”. However, a very high density survey had been acquired, and a series of “decimation” tests were conducted where both shots and receivers were removed and the final images were compared with the original full fold data to attempt to understand how much fold is really required in this area. Decimation testing went as far as removing alternate shot lines and alternate receiver lines, as well as alternate shots and receivers. The combination of all of these leads to a reduction in fold by a factor of 16. Decimation testing suggested that good data could be achieved with significant reduction in field effort.
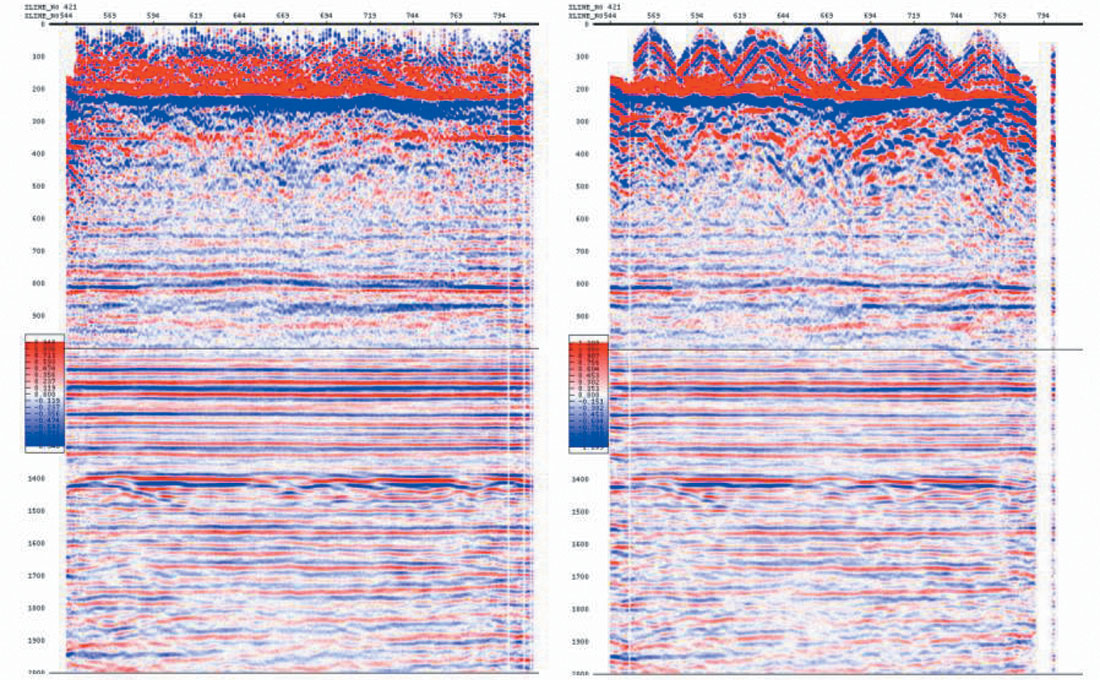
The section on the left of Figure 8 is a PS line from the original survey with all data processed. The section on the right is from a decimated data set where every other receiver line is removed, every other shot line is removed, and shot density along the line is halved. Fold is reduced by a factor of 8, there are few differences and interpretability remains similar in the 3D volume. As a result, a significant change in shot and receiver density was suggested for the second survey.
Additionally, a new impulsive source was proposed. Apache had experience in Canada of using impulse “thumpers” as a source for acquisition. Costs for these sources can be less than dynamite and it is possible to increase the shot density significantly along the line without significant cost increase. It was hoped that fold could be built up through this increase in shot density along the source lines. While the first acquisition utilized a source line direction set at an angle compared to the receiver lines, in the second acquisition the natural half-mile orthogonal grid of roads and boundaries in the area was utilized for both shot and receiver lines. Consequently, as a result of the analysis of the first data set, nearly everything was changed for the second set of acquisition.
In summary the initial plan for the second survey was to:
- Increase the source and receiver line spacing by a factor of 2 (approx).
- Decrease the source spacing by factor of close to 3 and decrease the receiver spacing from 34 m to 30 m.
- Decrease slightly the average trace density.
However, as a result of some operational problems, these plans were rethought after several days of production, and the impulsive Thumpers were replaced with Vibrators. The net result was:
- Operational issues prevented use of the Thumper as a source for the entire survey and it was replaced by conventional Vibroseis units.
- Source density along the line reverted to roughly that of the original survey.
- Trace density was reduced by approximately a factor of 4.
In the north of the survey area, where initial Thumper acquisition had started, the data were re- acquired with Vibrators to ensure that a complete data set was acquired with a single source.
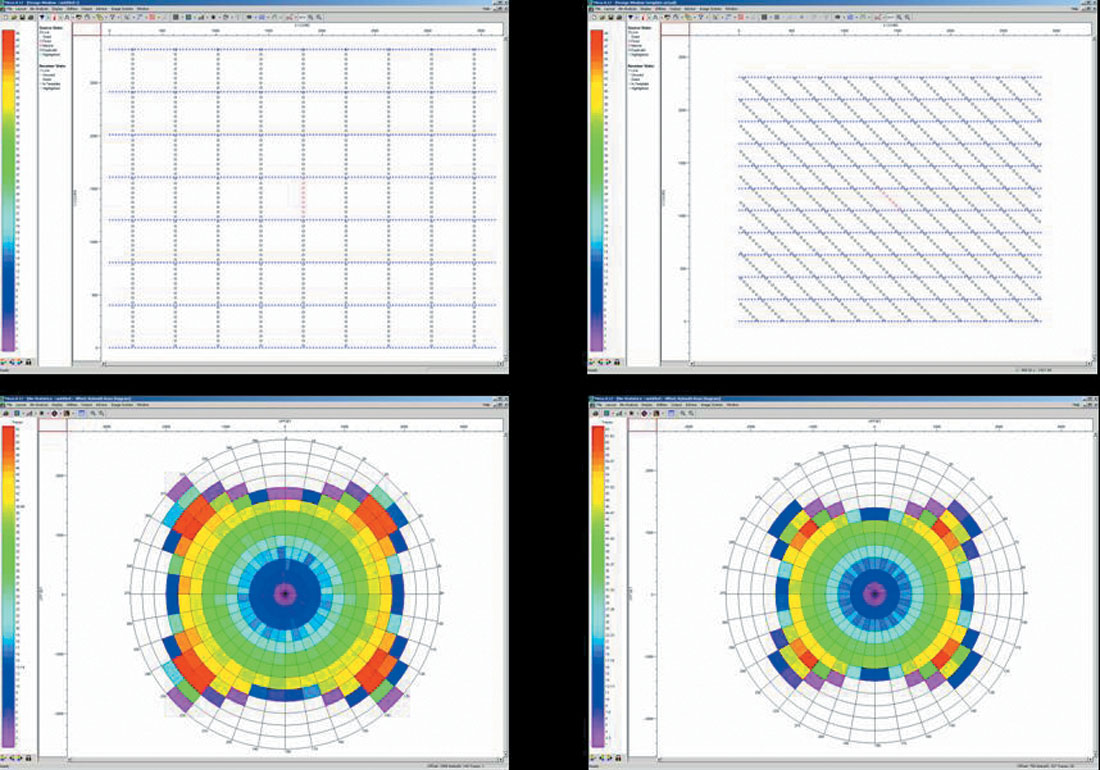
An examination of the final survey “template” for the 2 surveys is worthwhile, given the significant number of changes. The new template is generally “larger” than the original template and yields slightly longer offsets, which were found to be useful for the mode converted arrivals. Everything is more spread out with longer offsets and sparser shot and receiver lines. Offset azimuth distribution is good for both templates but fold is significantly reduced for the new layout.
Conclusions
As a result of this series of acquisitions, we have acquired what we believe to be a unique dataset, where we have 3C data acquired with dynamite, thumper and Vibroseis source effort. This data set contains varying fold and offset contributions.
At the time of writing, the second data set has been processed for P-wave only through a “rapid” sequence. Reprocessing of the P-wave data and first processing of the PS data is currently underway. However, it is possible to examine lines passing through all 3 different source type acquisition areas. Figure 10 shows an arbitrary line through the 3 data types.
Data in Figure 10 is presented as received from processing contractors, where it has been processed completely independently by 3 separate contractors without consideration to the other data sets. Given this, the degree of tie between the different data sets is remarkable. No attempt has been made at this stage to tie any of the data sets to well synthetics.
The East Central Alberta project has proven to be an ideal area for testing multi-component acquisition and the usefulness of mode converted data for lithology determination in a particular geologic setting due to quality of data. It is difficult to record poor conventional data, and the converted wave data continues to show promising results. The initial PS results are encouraging and good success has resulted from subsequent wells. Several wells are planned in the area covered by the second survey. These locations have been picked using PP interpretation only at present but PS data should be available before the wells are spudded.


Join the Conversation
Interested in starting, or contributing to a conversation about an article or issue of the RECORDER? Join our CSEG LinkedIn Group.
Share This Article