Abstract
The use of 3-D seismic interpretation and visualization in today’s industry has become pervasive in exploration and development. All modern 3-D interpretation systems and many well path planning systems use 3-D visualization as the base display for the interaction required to conduct the work at hand. However, the tools and techniques for “picking” geologic features in the data have advanced very slowly since the advent of interactive interpretation systems in the 1980’s.
In today’s industry, costs have escalated, and a generation of the most experienced explorationists is retiring to be replaced by a smaller number of talented, but much less experienced workers. This new generation will be confronted by the need to interpret more data in less time in an effort to find and develop increasingly complex reserves of oil and gas. To assist this effort, technologies have been developed to move 3D interpretation from tools that support viewing the data in 3-D (and interpreting it in 2D) to tools that enable the interpretation of the data in 3-D – True Volume interpretation.
Introduction
The first 3-D interactive interpretation systems, developed in the early 1980s, contained early forms of 3-D horizon autotracking – the first True Volume interpretation technique. It allowed the interpreter to extract a complete 3-D surface corresponding to a reflection in the seismic volume – a horizon from one or several seed points. Interactive 3-D visualization was added to interpretation systems in the early 1990’s. Aside from 3-D horizon autotracking, however, the interpretation of features in the seismic volume remained a largely manual 2-D process – interpreting the intersections of the geologic feature with a set of 2-D slices through the 3-D volume. In the late 1990’s, 3-D geobody autotracking (voxel tracking) allowed the “interpretation” of connected voxel “blobs” in 3-D datasets. Features interpreted in this fashion might include portions of channels or other stratigraphic features imaged in seismic amplitude or attribute volumes.
In 1999 to the early 2000’s, it became possible in certain situations to automatically extract fault surfaces (AFE patented by ARCO in 1999, Ant Tracking from Schlumberger). However, all other imaged geologic features (salt bodies, canyons, boundaries of depositional systems, other stratigraphic features, etc.) must still be interpreted on individual 2-D slices (inlines, crosslines, and time or depth slices) manually. These interpreted 2-D segments are then put together to represent the 3-D geologic feature of interest.
True Volume interpretation, the interpretation of all geologic features represented in a 3-D volume as complete three-dimensional surfaces, must be developed to meet the demands of exploration and development in the future. True Volume interpretation enables the direct “all-at-once” interpretation of complete 3-D surfaces representing not just horizons and faults, but also salt bodies, channels, fans, and other geologic surfaces. The end result is an interpretation that is much more accurate and complete since all of the data in the 3-D volume representing a given structural or stratigraphic feature are used simultaneously to obtain the result. It also provides a substantial reduction in the time required for interpretation compared to traditional methods. Table 1 shows a comparison between the tools provided in a typical 3D interpretation system (“Classic”) and those provided for True Volume interpretation.
This style of interpretation is supported by a combination of new workflows, new processes, and new interpretation tools to enable the interpretation of complete 3-D surfaces in the data volume.
| Interpretation Goal | Classic | True Volume | |
|---|---|---|---|
| Table 1 | |||
| Structure | Salt Bodies | 2-D | 3-D |
| Canyons | 2-D | 3-D | |
| Faults | 2-D | 3-D | |
| Horizons | 2-D | 3-D | |
| Stratigraphy | Geobodies | 2-D | 3-D |
| Depo Systems | 2-D | 3-D | |
| Stratigrapy | 2-D | 3-D | |
Advances in Structural Interpretation
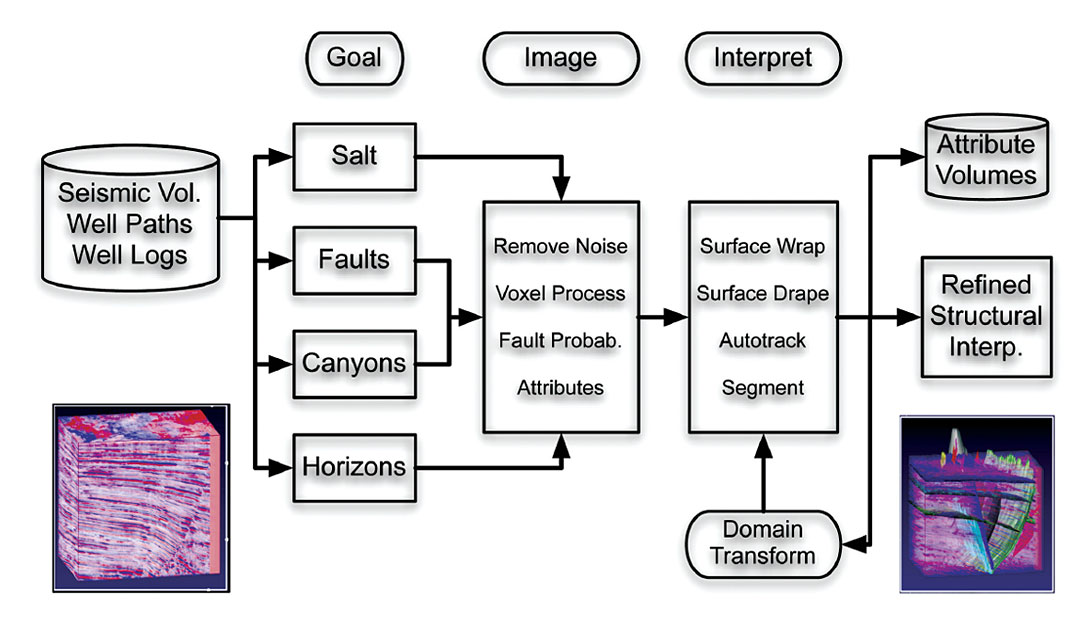
Figure 1 is an example of an integrated 3-D workflow for interpretation of structure and depositional systems. The order in which structural elements are interpreted depends on the geology that is represented in the data, and upon our understanding of geological relationships. In all cases, the workflow begins with the identification of the type of geologic feature of interest (e.g., salt, fault, canyon or horizon), followed by processing to create an attribute volume that optimizes the imaging and visualization of that type of feature in the volume. The imaging step is then followed by a 3-D surface interpretation step employing technology that may range from 3-D autotracking to direct 3-D surface definition and editing.
Salt
Since certain structures can impact the accuracy of interpretation of other features in a volume, the workflow initially focuses on the boundaries of salt bodies (if present), as these truncate faults and horizons. A common approach to salt body interpretation today in a classic interpretation system is to manually pick the boundary of the salt as a set of polylines (fault polylines are typically used) on a sparse set of inlines and crosslines (Figure 2). This set of “ribs” is then fit with a triangulated surface to approximately represent the boundary of the salt.
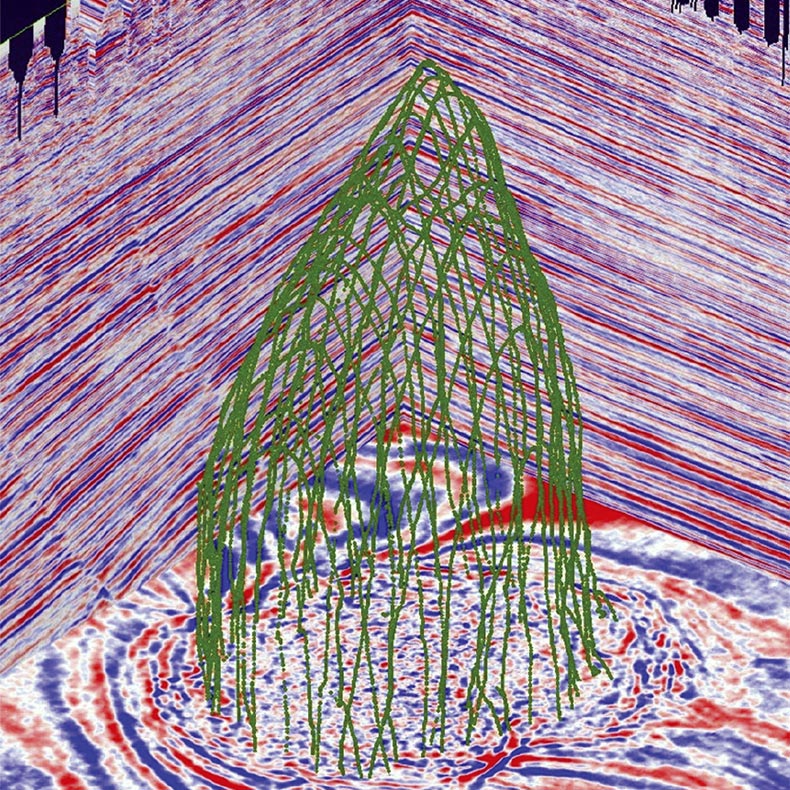
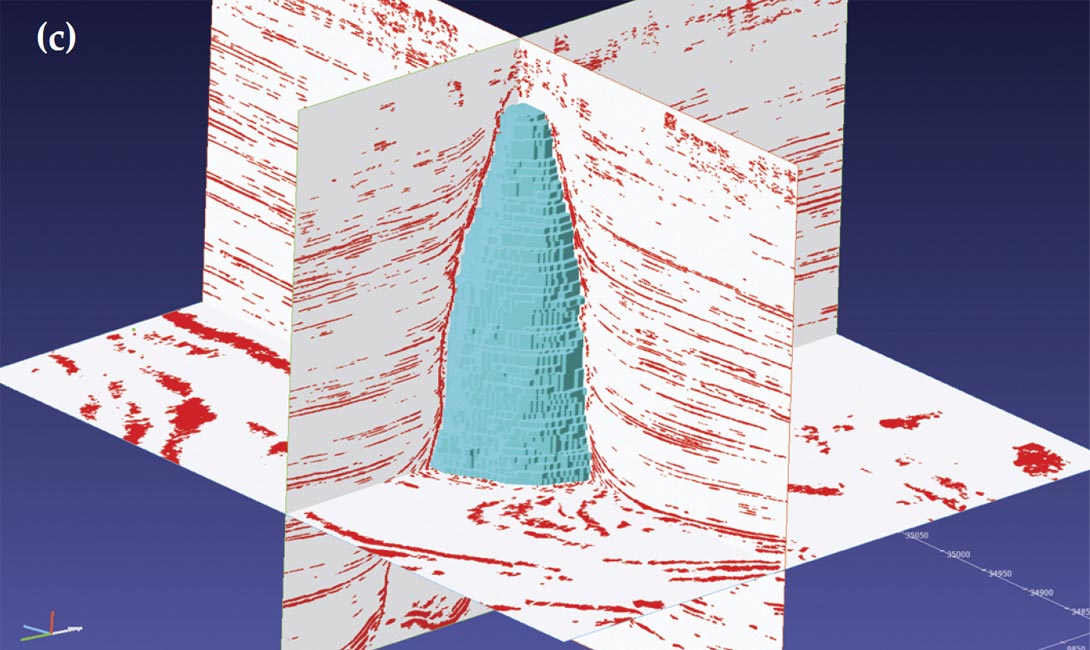
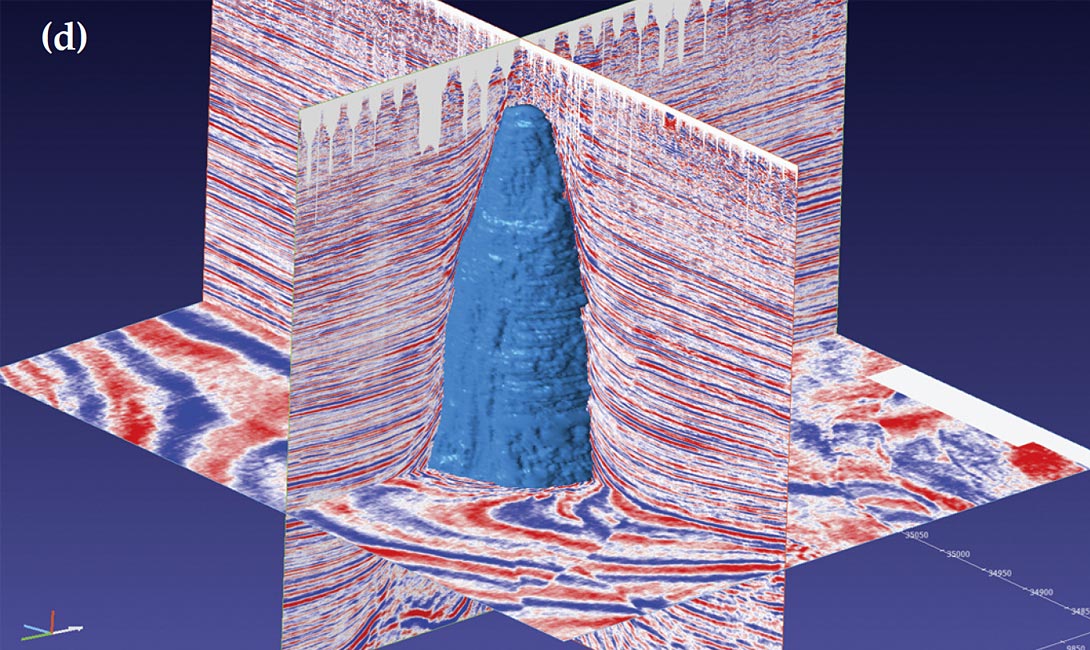
A much higher resolution interpretation of the salt boundary may be interpreted in substantially less time using a newly developed technology illustrated in Figure 3. Voxel processing is applied to the seismic volume to isolate the imaging of the salt boundaries. The interpreter quickly creates an initial 3-D surface inside the salt. This initial surface is then “inflated” or expanded interactively until it stops on the imaged boundary of the salt. The final surface can be snapped to peaks, troughs, or a combination of peaks and troughs, as may be appropriate when a top-salt reflection is a peak and a base salt reflection is a trough.
Faults
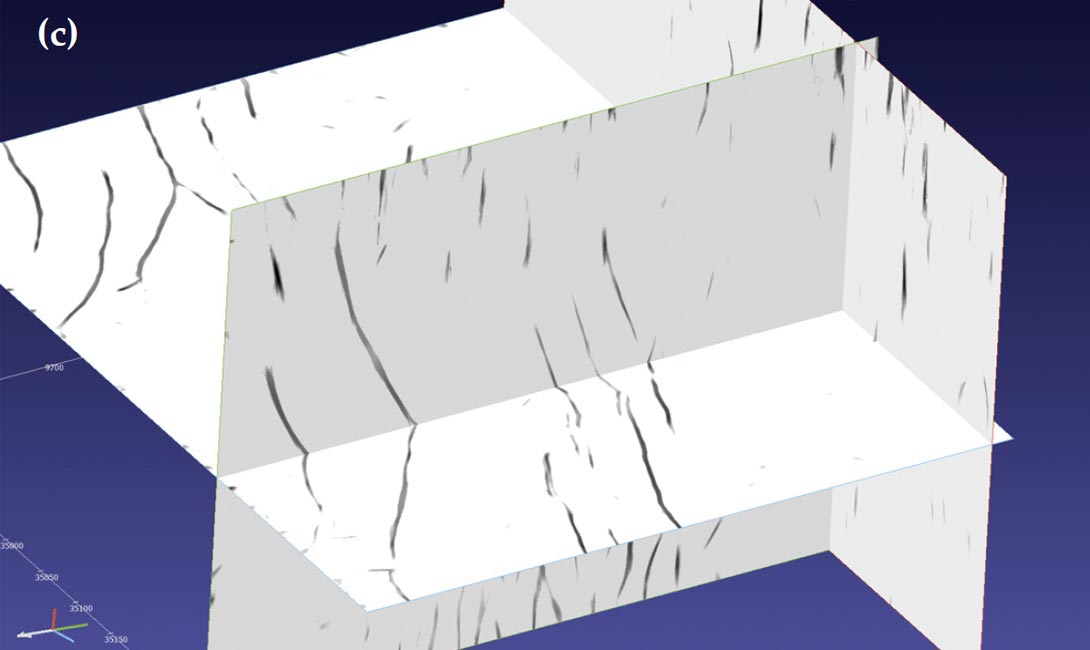
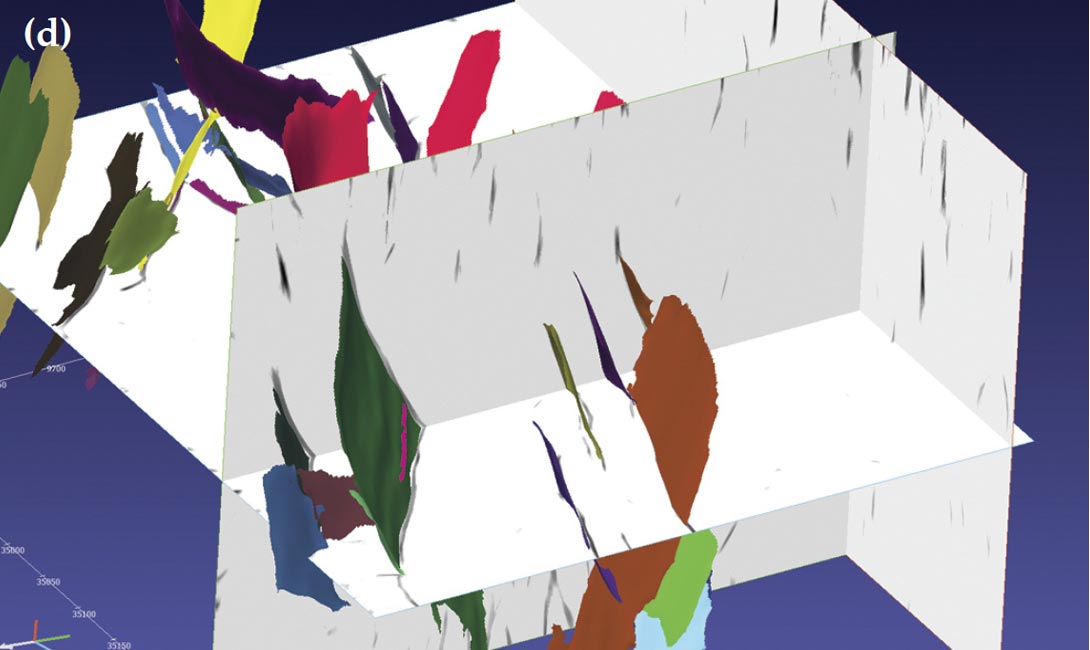
Fault surfaces are imaged primarily as discontinuities within the seismic data. The Automated Fault Extraction (AFE) uses a discontinuity or coherence volume as input and creates a fault probability volume. The faults are imaged in the fault probability volume with sufficient resolution and signal-to-noise level to support automatic interpretation of the fault surfaces. The AFE workflow is illustrated in Figure 4. It begins by creating a discontinuity volume (in this case an edge stack volume) from the seismic data. AFE is then used to create a fault probability volume from the edge stack volume. The faults in the resulting volume are imaged with sufficient resolution and signal-tonoise ratio to allow the interpreter to either automatically extract major faults from the volume, or selectively autotrack faults from the volume.
Horizons
The final step in the structural workflow is horizon identification. There are a large number of quite sophisticated horizon autotrackers available in the industry. Horizon autotracking is an example of true 3D surface interpretation that has been around since the early 1980s. As such, we won’t spend any time describing them here.
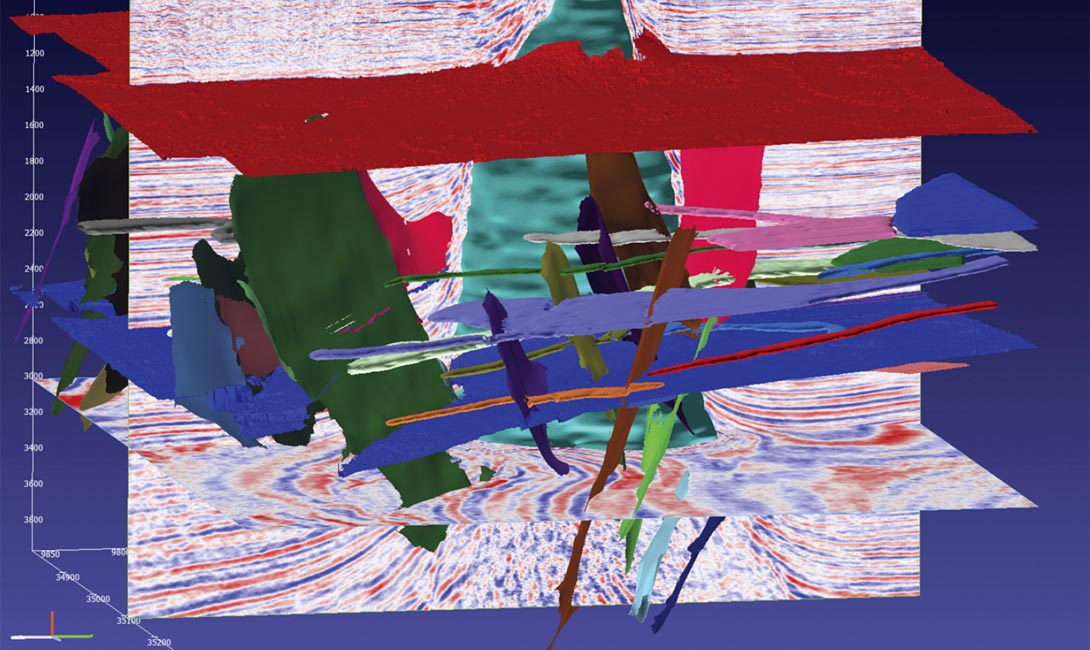
The end result of structural interpretation is that along with the seismic volume, we now have several attribute volumes and a structural interpretation. In this case, that interpretation includes a salt body, faults and horizons (Figure 5).
Advances in Stratigraphic Interpretation
The initial interpretation of the structural features in a volume is necessary to enable the imaging and interpretation of stratigraphic features and depositional systems in the data. The problem with trying to recognize and interpret depositional systems in the original seismic volume is that the structural effects on the seismic data make the depositional features quite difficult to recognize and interpret. Figure 6 shows a time slice from the seismic volume with a segment of a 1km wide channel apparent on the time slice. Although the channel extends across the entire volume, it is difficult to interpret and put the pieces back together because it extends across 7 fault blocks that are shifted and rotated with respect to each other.
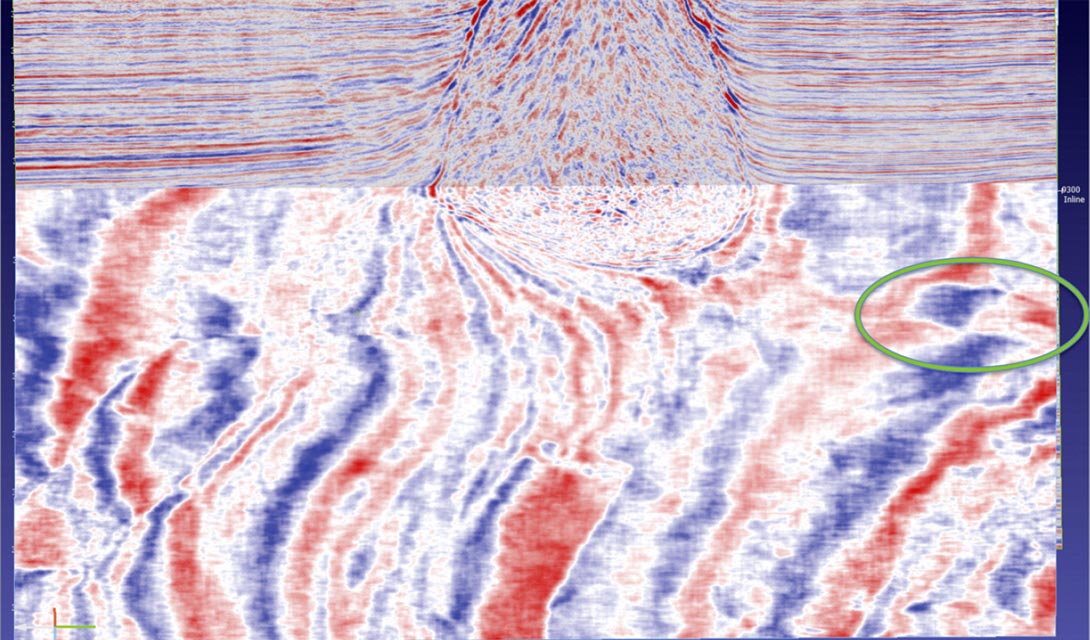
It has been recognized for some time, that a horizon slice (an amplitude extraction through a seismic volume in the shape of an interpreted horizon), or slices around a horizon that has been used to flatted a seismic volume can be quite helpful in recognizing depositional features that are at or near to the interpreted horizon. Conceptually, the Domain Transformation™ extends this concept by removing all structural effects in a seismic volume. In this 3D spatial transformation, all structure is removed from the volume, resulting in a volume consisting entirely of stratal slices. In the resulting stratal volume, all seismic reflections are horizontal, representing paleo-depositional surfaces.
Domain Transformation
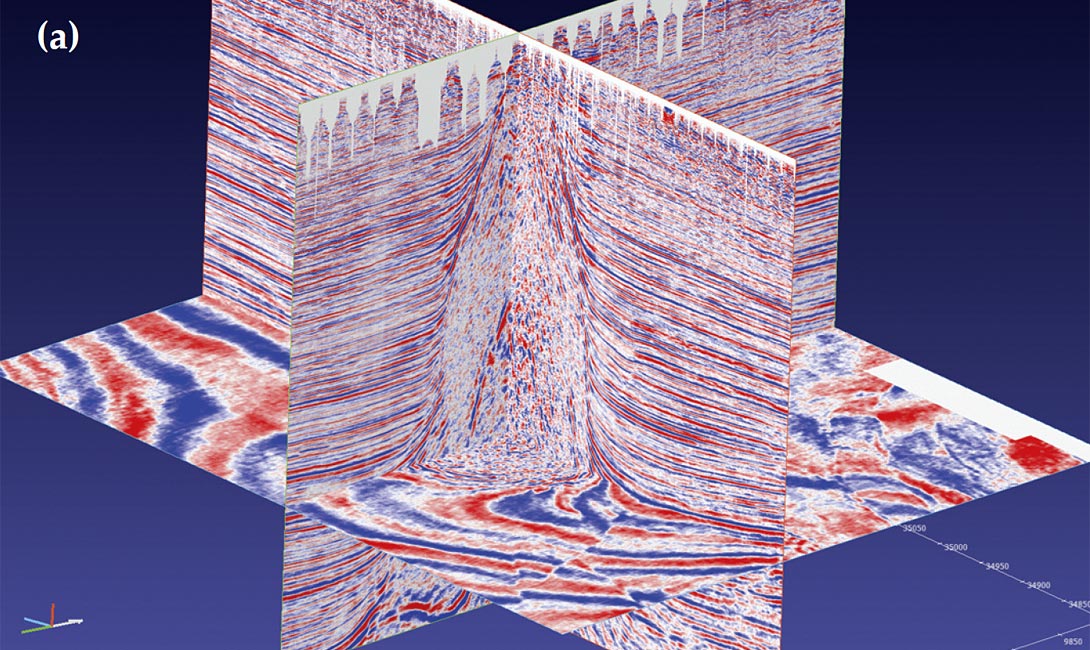
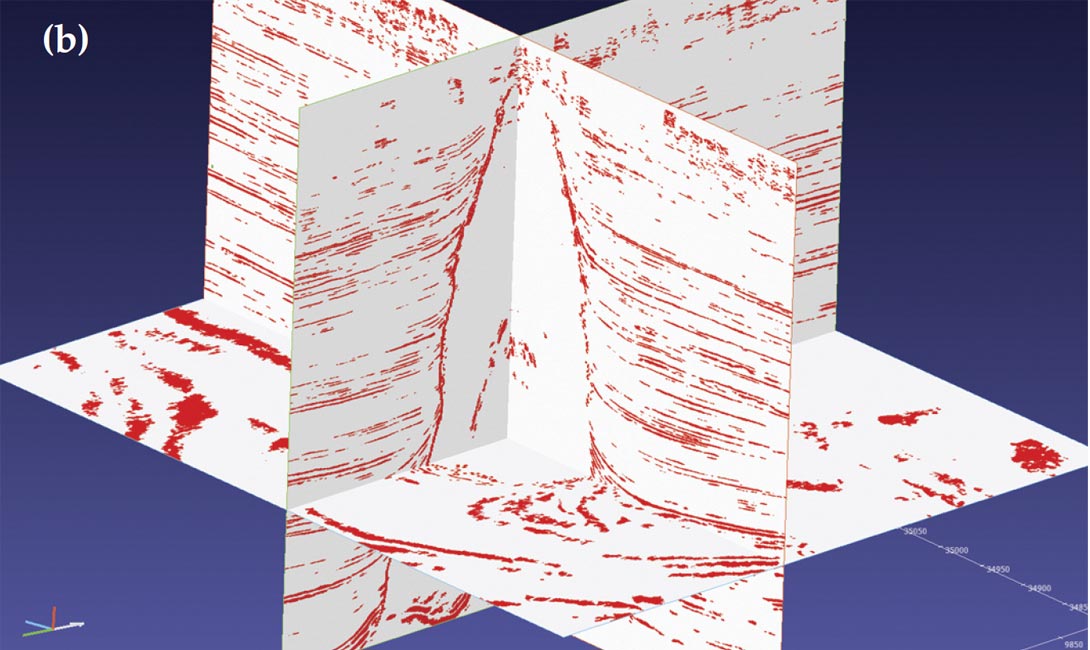
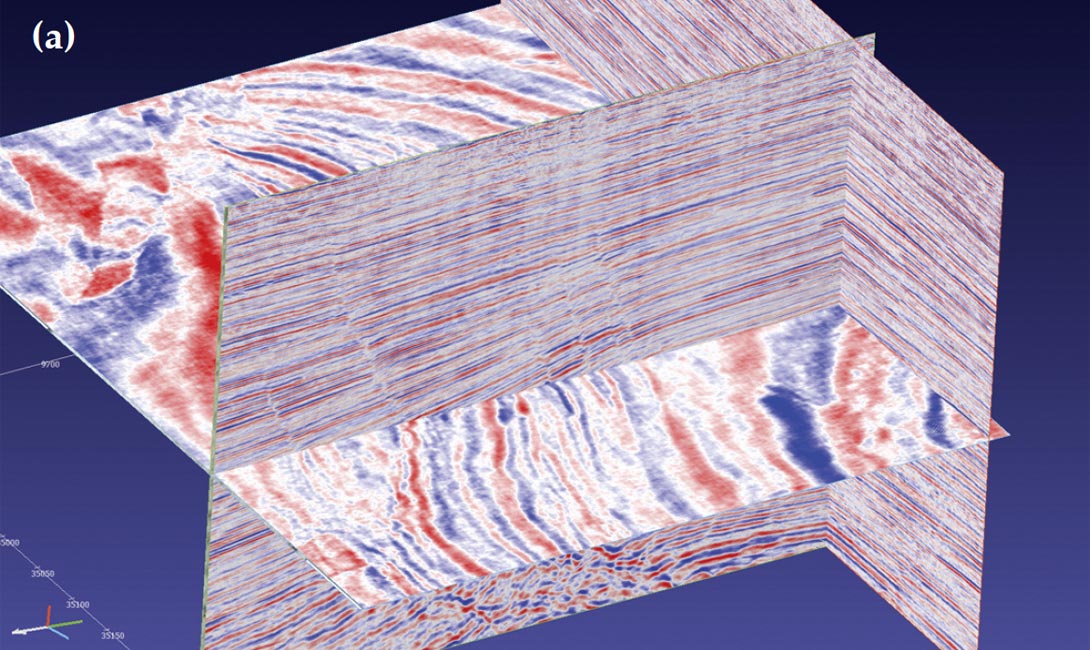
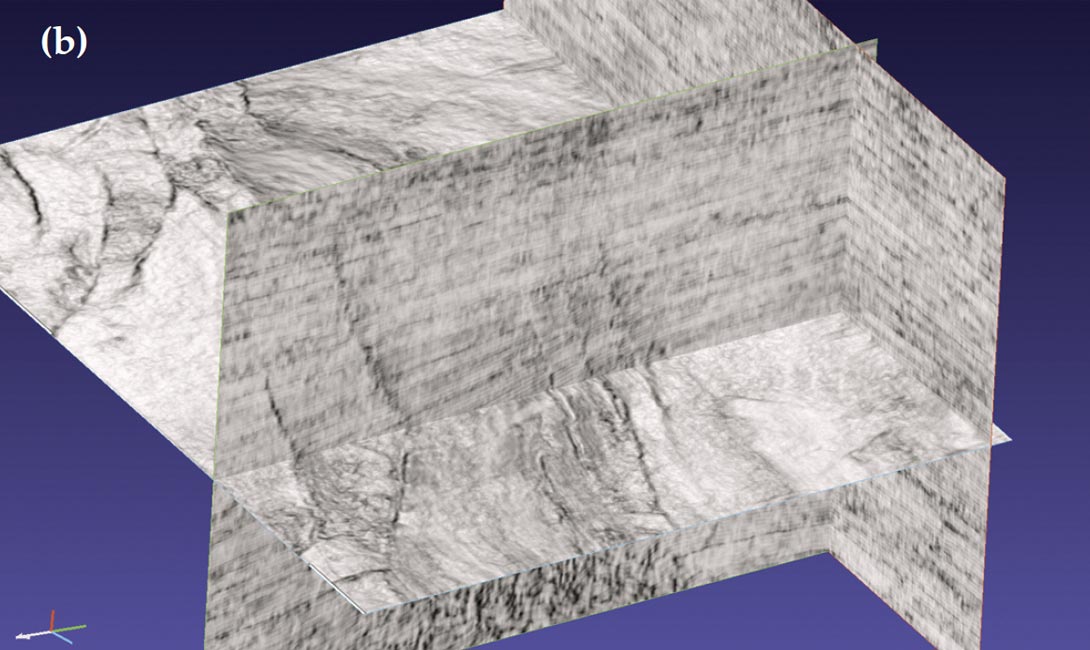
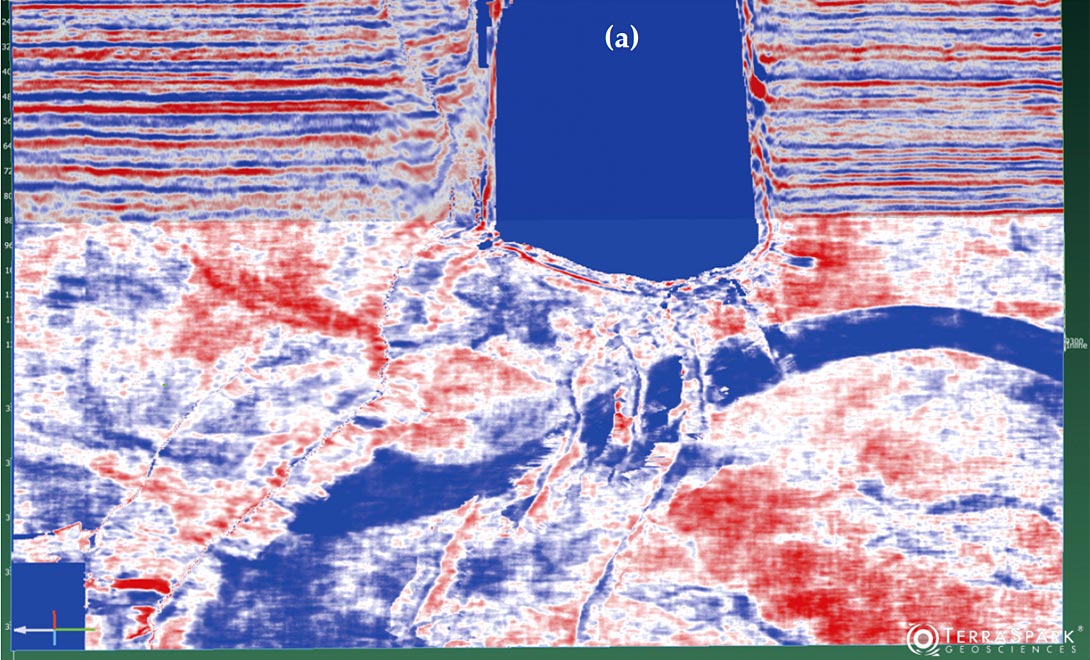
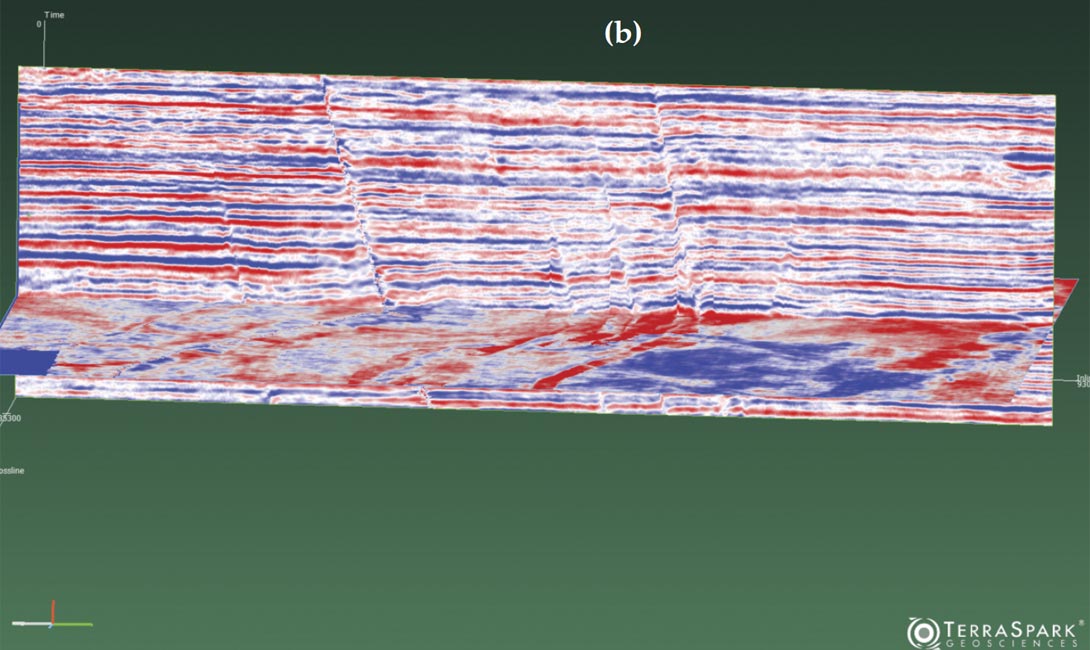
The concept of the Domain Transformation is, at its heart, quite simple. First the data is interpreted for structural elements (salt, faults, canyons, and horizons). It is the presence of the structure in the data that has distorted and displaced the original depositional systems. These structural elements are then processed to remove noise. Horizons are trimmed and sealed to faults and salt surfaces, closing the structural interpretation. Next, the distortions caused by the structural elements are removed from the volume, producing a “stratal volume” where every horizontal slice represents a paleo-depositional surface. At this time the Domain Transformation can properly handle differential sedimentation, differential compaction, unconformities, angular unconformities, carbonate buildups, salt bodies, canyons, and removes both the vertical and horizontal components of fault displacement. The result of a Domain Transformation applied to the seismic volume used in this paper, using 5 horizons, 45 fault surfaces and the salt body is shown in Figure 7. Note that the seismic events are now all horizontal (Figure 7a) and the 1 km wide channel is now visible across the entire survey (Figure 7b).
Interpreting Depo-Systems
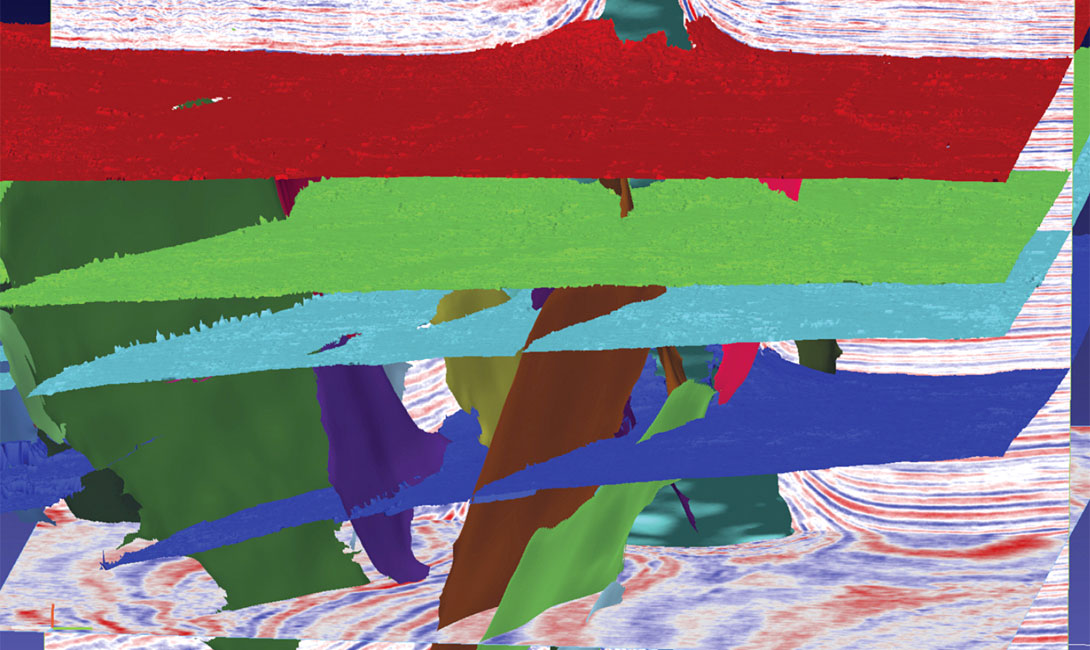
The resultant stratal volume clearly images any depositional systems present in the volume. Channels and fan complexes that were not previously visible in the faulted and dipping seismic volume become immediately obvious, and can be easily captured in the stratal volume by the same surface imaging and interpretation processes used to define salt bodies. The interpreted boundaries of these dipping channels are then transformed back into the structural domain, restoring the depositional features to their proper location in the seismic amplitude volume (Figure 8).
Summary
“True volume” interpretation is focused on delivering fully integrated 3-D seismic visualization and interpretation at every step of the interpretation workflow. By enabling direct 3D surface interpretation of all structural elements (faults, salt bodies and canyons in addition to horizons), it helps geoscientists work better and more efficiently. Domain Transformation enables much more rapid and thorough recognition and interpretation of depositional systems and other stratigraphic features. As a result it substantially reduces the cycle-time of interpretation while improving the accuracy and detail of the final interpretation. All of the data volume is used to create complete 3-D surfaces that most accurately represent all of the geology represented in the 3-D seismic volume.

Acknowledgements
The GIVC Consortium is supporting the development of the workflows and technologies described in this paper. This industry funded research consortium, operated by TerraSpark Geosciences, is entering its 8th year. Companies that have supported this consortium include BP, BHP Billiton, Chevron, ConocoPhillips, Repsol, Shell, Stone Energy, Paradigm, Anadarko and ExxonMobil. We gratefully acknowledge their support of this research and development.
Related Reading


Join the Conversation
Interested in starting, or contributing to a conversation about an article or issue of the RECORDER? Join our CSEG LinkedIn Group.
Share This Article