If the mounting success story of any technology be adopted as a yardstick for its acceptance, three-dimensional (3D) seismic definitely asserts itself at the forefront of advances made in hydrocarbon exploration in the last 30 years. 3D seismic surveys are being carried out not only for exploration but development projects as well, to secure additional reserves at significantly lower risk. However, during the formative years of 3D seismic technology, a lot of effort was spent in perfecting the 3D interpretation of these seismic data volumes on interactive workstations. Most 3D interpretation was performed on vertical in-lines and cross-lines and then projected onto a time slice. Though this works well, it leads to ambiguities in the lateral resolution of faults, especially where faults join together, cross or simply end as a result of geologic stress. It was during an opportune time (fall of 1995) that Amoco Production Research released to the world geophysical community its patented Coherence Cube technology.
It essentially consists in generating a cube of coherence coefficients (from the input 3D seismic data volume) that portrays faults and other stratigraphic anomalies clearly on time or horizon slices. These images show up distinctly, depicting buried deltas, river channels, reefs etc. Traditional seismic time slices are often used for interpreting faults that run perpendicular to strike. However, when faults run parallel to strike, they become difficult to interpret as fault lineaments become superimposed on bedding lineaments. Similarly, the remarkable detail of stratigraphic features such as river channels, mud flows and submarine canyons are unidentifiable even with close scrutiny.
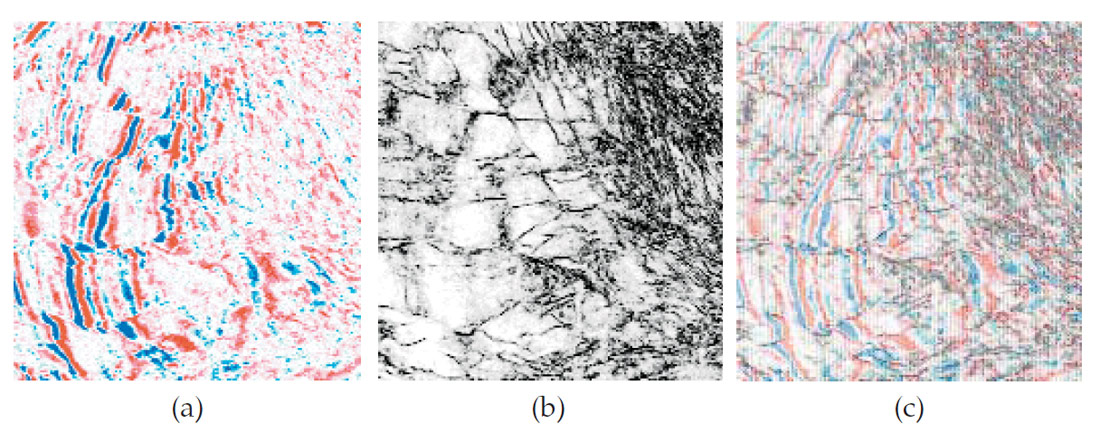
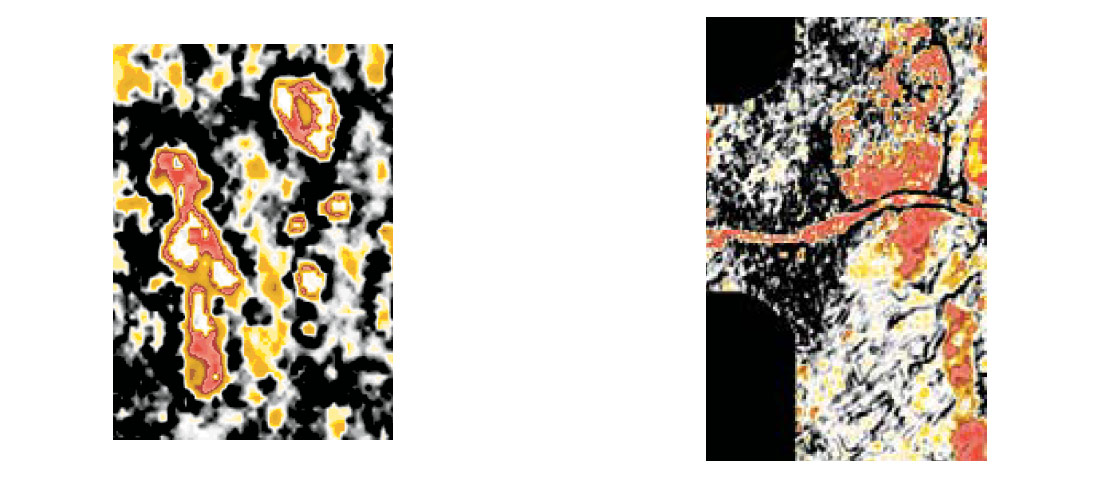
Coherence measurements in three dimensions represent the trace-to-trace similarity and therefore produce interpretable changes. Similar traces are mapped with high coherence coefficients and discontinuities have low coefficients. Regions of seismic traces cut by faults for example, result in sharp discontinuities in trace-to-trace coherence, producing delineation of low coherence along fault planes. Since three-dimensionality is an essential ingredient of coherence computation, faults or fractures in any orientation are revealed equally well. Fig. 1 depicts an example for offshore East Coast of Canada where NW-SE faults and fractures, apparently difficult to interpret, show up clearly on the coherence slice. Overlaying a seismic slice with a coherence slice could greatly help in interpretation (Fig. 1(c)).
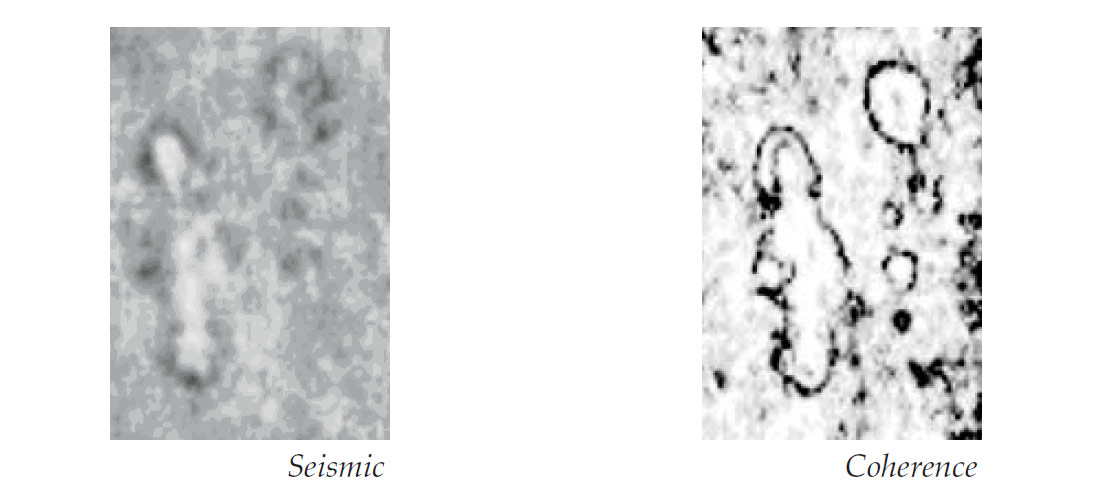
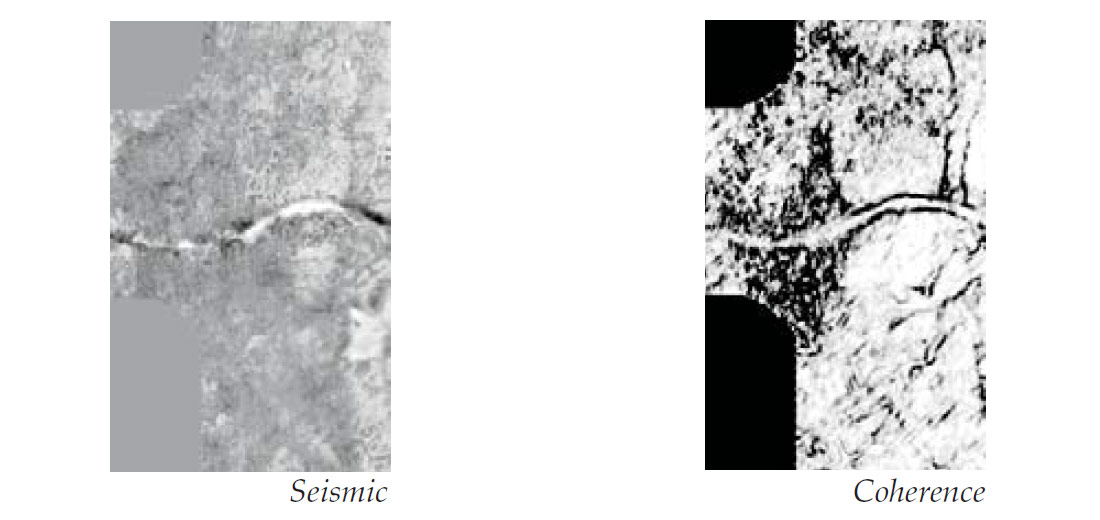
Stratigraphic features generate similar discontinuities resulting in sharp detection of reef and channel boundaries (Fig. 2 and 3) and deltaic sediments. Consequently, in addition to faults, channels, and beaches, coherence cube has been successfully used for easy visualization of mud volcanoes, mass wasting, dewatering features and others. An attractive characteristic of coherence cubes is that it gives an unbiased view of the features in the seismic volume - no interpretation is required for viewing them.
Since the introduction of the Coherence Cube in 1995, there has been a constant up-gradation of this technology by way of more refined algorithms, displays, applications and methodologies, aimed at extracting more meaningful detail that not only aid interpreters, but help them be much more accurate and time effective.
Algorithms
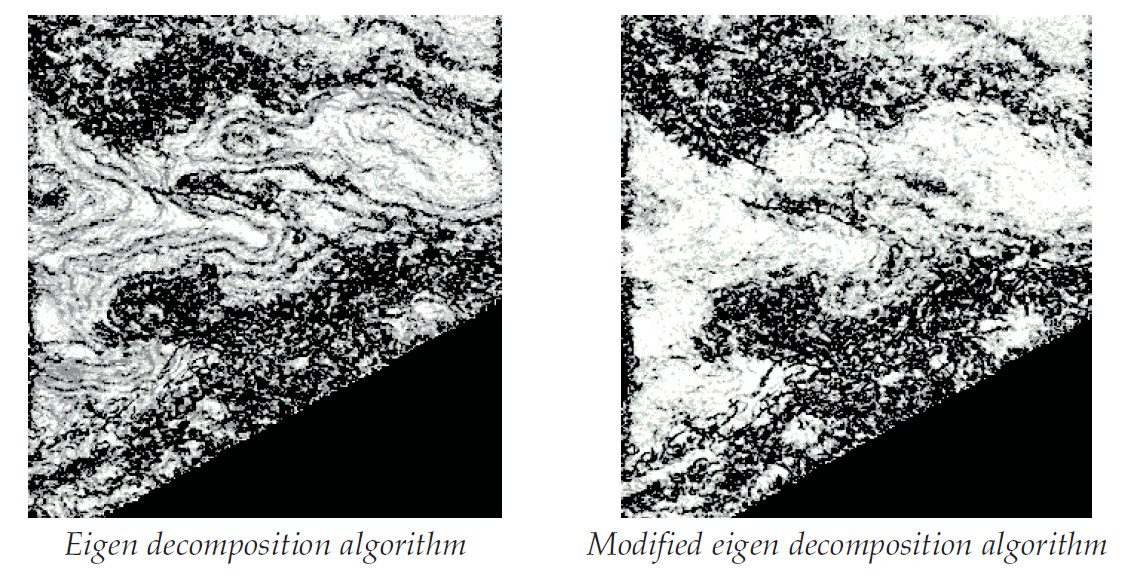
The original algorithm for coherence computation was based on cross-correlation of seismic traces. Thereafter semblance and eigen-structure decomposition algorithms were introduced. While the semblance algorithm provides more robust estimates for coherence even in noisy environments and higher vertical resolution (for good quality data) the eigen-structure algorithm, being mathematically more rigorous produces sharper and clearer images. However, in the presence of strong dips it was not found to be effective. This was quickly taken care of. Fig. 4 shows a time slice from a coherence volume wherein structural contours are seen masking the roughly E-W faults in the center. The same time slice on the right shows the faults clearly and there are no structural contours to interfere with the interpretation. This modified eigen-decomposition is the most current and accurate algorithm available for generating coherence cubes.
Attribute Composite Displays
Complex trace seismic attributes including measure of seismic amplitude, frequency and phase have been successfully used in mapping lithology changes in the last two decades. During computation of coherence using the semblance method, it is possible to obtain a more smooth and robust multi-trace estimate of the complex trace attributes. While such attribute volumes can be used individually, it is possible to generate convenient composite displays. Occasionally, on coherence slices, one encounters high coherence envelope amplitudes within channels, point bars or reefs. For ease in identification and corroboration, another coherence volume is created which has the coherence coefficients intact, but the high-end amplitudes from the coherence envelope volume are overlaid on it. The high envelope amplitudes corresponding to the events of interest stand out as ‘bright spots’ on coherence slices. Fig. 5 shows the composite displays for the reef and channel features shown in Fig. 2 and 3. Such displays help in identification of the nature and extent of depositional features but also help in gaining understanding of depositional environments.
Similarly, by integrating the coherence and impedance volumes, acoustic impedance changes can be readily identified within sedimentary systems, resulting in unparalleled detail of subtle sedimentary depositional features. Acoustic impedance results may be numerically combined with the coherence results, producing a volume that would allow the interpreters to display the stratigraphic images from the 3D seismic data and examine the acoustic impedance contrast across them. For example, sand deposition within a channel that is gas charged would exhibit low impedance. So, a range of low impedance representing the gas sands may be selected and merged with the coherence cube. The composite merged volume so generated may again be sliced through to see low impedance (in colour) displayed within the boundaries of the channel.
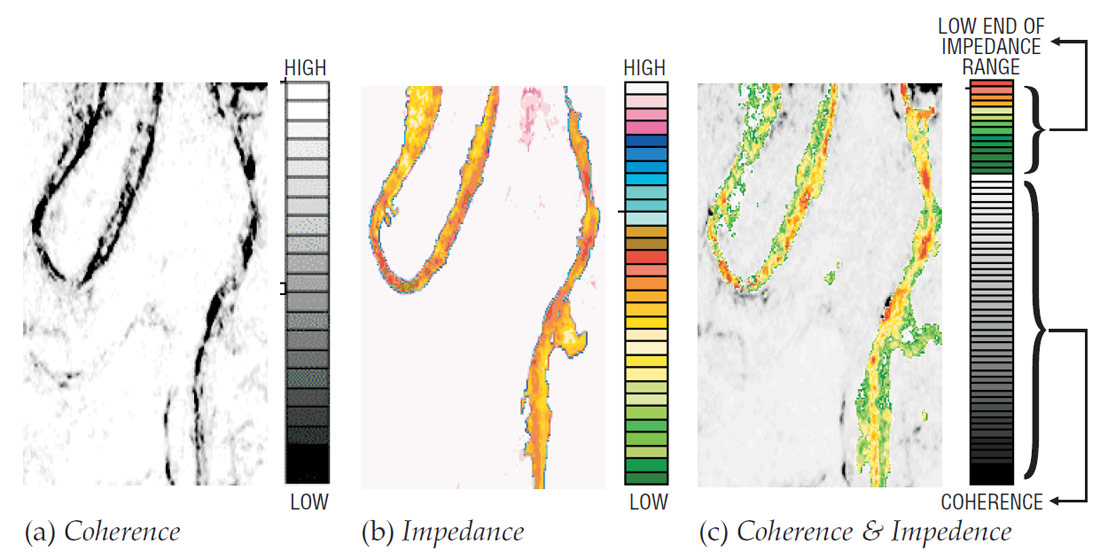
Fig. 6(a) shows a coherence slice depicting two channels that stand out clearly in a high coherence background. The impedance slice (Fig. 6(b)) indicates low impedance within the channels implying the presence of hydrocarbon bearing sands. The low end of the impedance can now be merged with the coherence and stretched over a suitable scale (Fig. 6(c)) to see the variation within the low end of the range of the impedance values chosen.
Such composite plots could be convincingly used to define precise reservoir and non-reservoir facies boundaries and reservoir compartments.
Acquisition Footprint Detection and Removal
Acquisition footprint is a term used to define linear grid patterns seen on 3D seismic time slices that tend to ‘mirror’ parts of the acquisition geometry used for shooting the seismic survey. They are usually seen on shallow time slices or horizon amplitude maps as striations masking the actual amplitude anomalies under consideration or stratigraphic interpretation. Apart from the acquisition footprints, processing artifacts could also result in prominent lineations on the seismic slices that prevent accurate mapping of amplitudes. Such patterns have an adverse effect on any subsequent special processing that may be undertaken. For example, the inverted impedance volumes would carry undesirable striping on the slices.
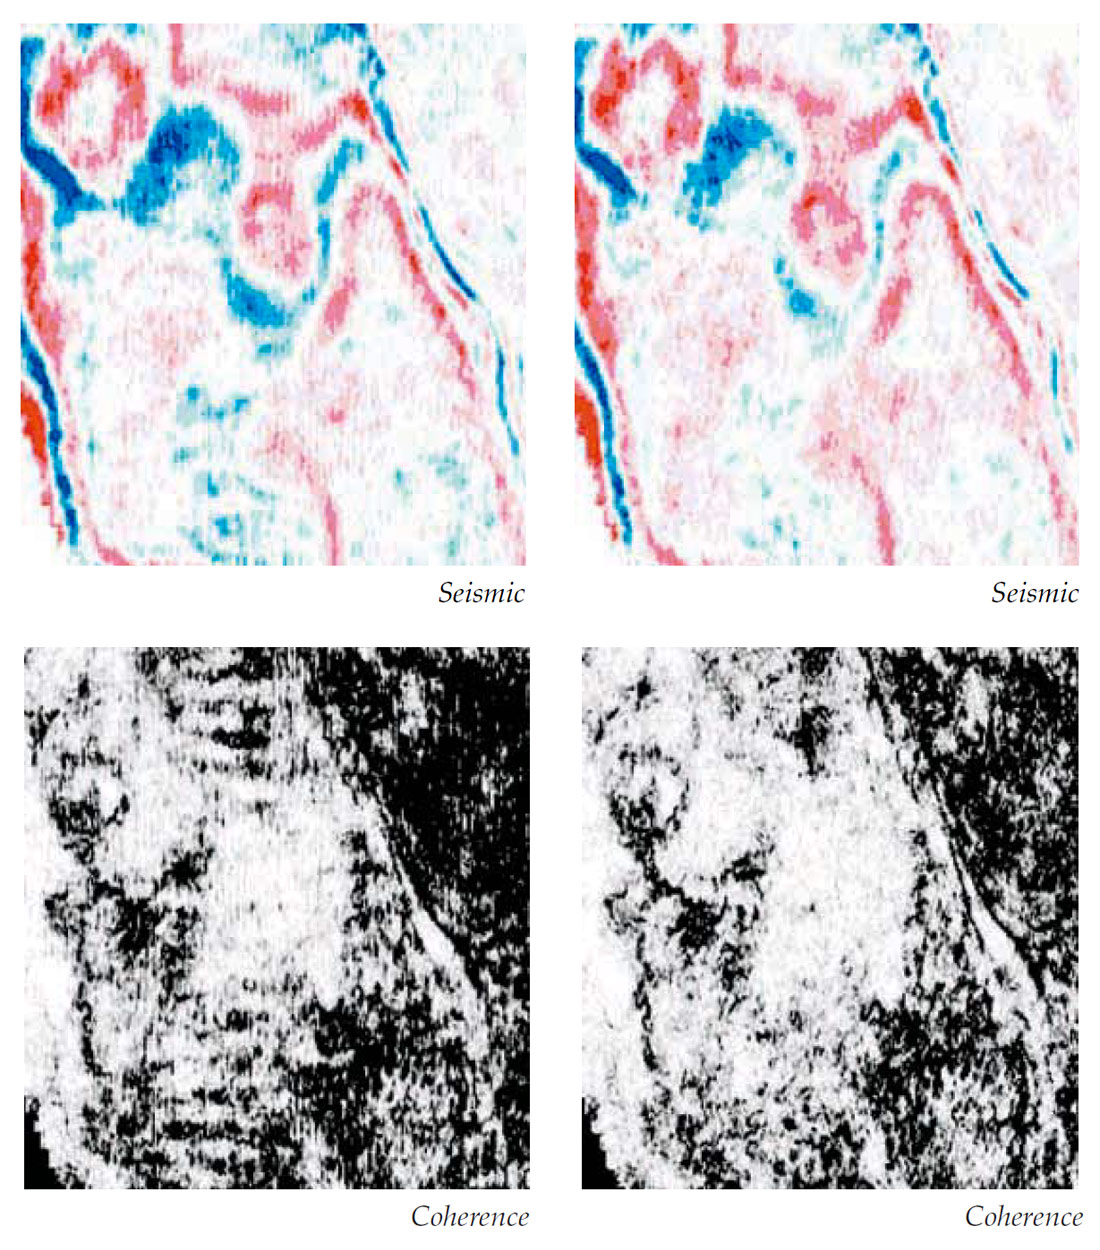
Though acquisition footprints need to be taken care of at the time of survey planning, their removal can be effected at the time of processing. Coherence affords an elegant tool for detecting the footprints during the processing flow and then deciding on the most accurate way they can be attenuated. As seen in Fig. 7 acquisition footprints are not so apparent on the seismic time slice but show up clearly on the coherence slice. So a good job has been done for their removal.
Fault/Fracture Detection
Interpretation of faults can be carried out on 3D seismic data volumes if their location and throws are discernible. Small faults have a minute reflector offset that in most cases appears as an inconsequential disruption. Minor faults are usually not directly detected on the seismic volumes though indirect evidence (from well data or geological setting of the subsurface) does suggest the existence of faults and fractures in the area. A new method has been devised for detecting such faults and fractures in 3D seismic data by taking advantage of the azimuthal variation of seismic signatures and coherence.
It consists in trapping off a restricted azimuth range from the full 3D seismic wavefield, so that azimuthal variation of moveout and amplitude does not get obliterated. Appropriate steps are taken to ensure an adequate offset and azimuth distribution within the individual sub-volumes which are then examined through the eyes of coherence. Fig. 8 shows the time slices at 1312 ms from the coherence volumes. Some NE_SW faults are seen on the conventional time slice but are not so distinct. Different azimuth coherence slices show up better alignment not only in the NE-SW direction but in the orthogonal direction as well. A distinct cross fault is seen on the 157.5 to 202.5 degrees azimuth volume.
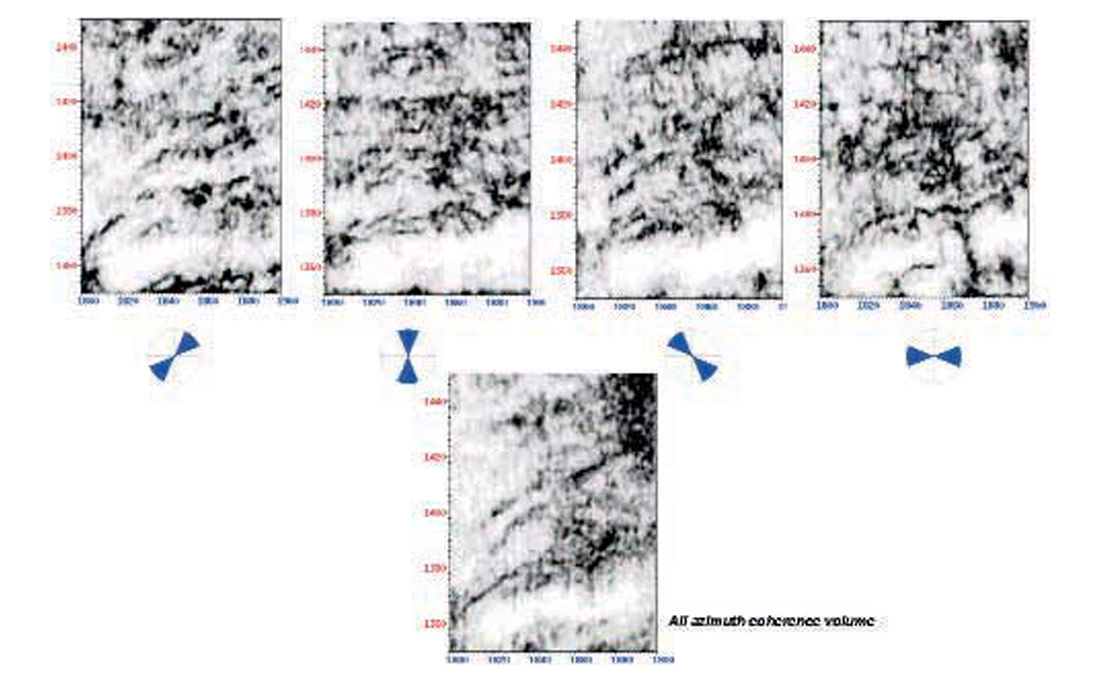
An important observation is that despite significantly lower fold of the restricted azimuth volumes, superior imaging is seen in the fracture-perpendicular direction. This result is intuitive to standard practices and suggests that both the fault-parallel and fault-perpendicular volumes need to be analyzed for accurate fault interpretation.
This methodology is very significant for identifying zones where productivity is influenced by fractures and faults.
Sharpened coherence cubes
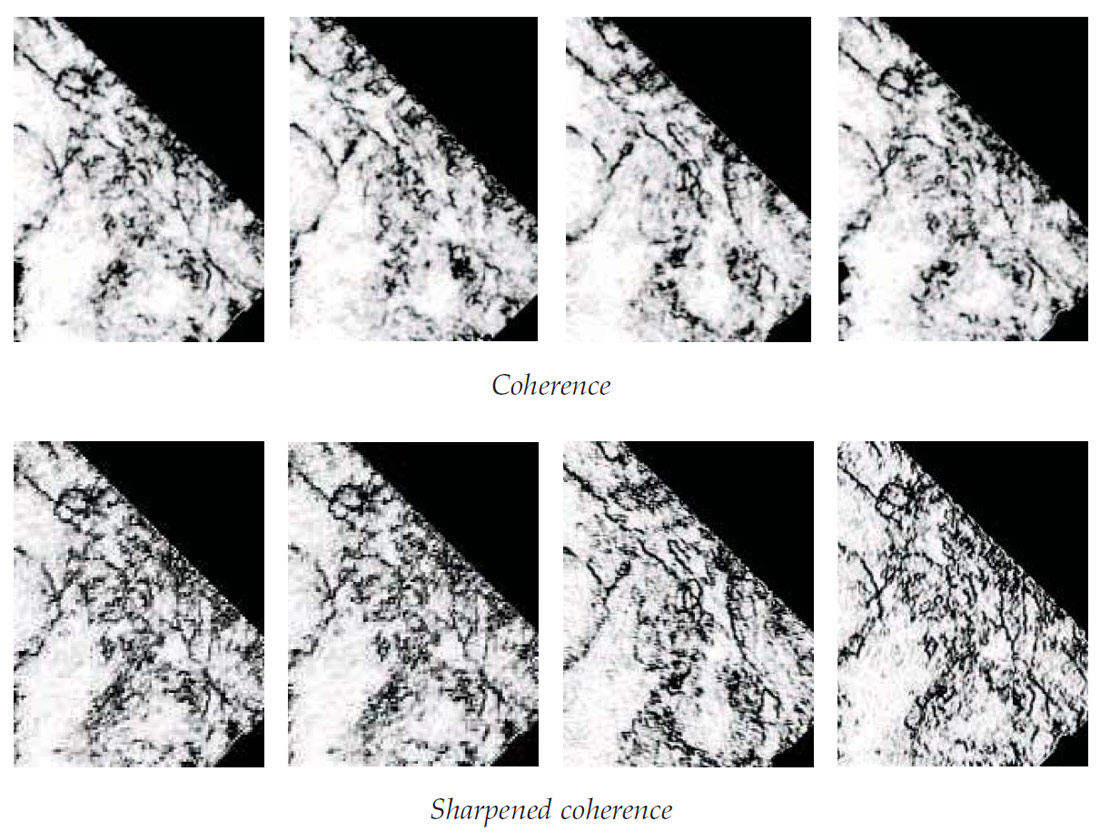
It is possible to extract more detail out of the coherence cube slices. A new algorithm that combines the eigen decomposition of covariant matrices and edge enhancement operators can be applied to the 3D seismic data. The output is a 3D cube of sharpened coherence coefficients. Apart from a straightforward computation of sharpened coherence cube, it is possible to impart a feeble directional bias during the sharpening process, which tends to accentuate the fault or fracture lineations. Fig.9 depicts a set of coherence slices and a corresponding set of slices from the sharpened coherence volumes with directional bias. Evidently, faults can be tracked easily on such displays and their mapping could be done conveniently and accurately.
Complimentary Processing Tool
Integration of Coherence Cube imaging into the seismic processing flow produces optimal images of the subsurface. Coherence Cube processing is resorted to at different steps to effect optimum choice of processing parameters, noise reduction methods or migration velocities. For example, coherence cubes are generated for a range of migration velocities and those velocities chosen that best image the data.
Pre-stack Analysis
The seismic response is known to be sensitive to lithology, porosity and fluid changes across the seismic offsets (AVO effect). The near offset range is influenced more by structural effects and the longer offsets show more litho-fluid effects. However, typically the seismic stacked response produces an average of these responses. AVO analysis is performed to study the amplitude response with offset or angle of incidence. Coherence is being used across the offsets to examine the waveform rather than simply the amplitude across the offset range. Thus prestack time or depth migrated gathers are arranged into offset range stacks or angle gather binned stacks and coherence applied to each offset volume over a window of interest. Rapid animation technology is used to examine changes in seismic waveform across spreads. It is possible to produce visual results comprising similar waveforms only. Such an approach reveals subtle geologic features often lost in conventional processing e.g. significant changes in faulting can be observed with varying offset volume slices.
Coherence - a promising tool
Tested extensively and successfully in different basins around the world, coherence processing has evolved and developed into an indispensable tool that effectively extracts a vast amount of information from 3D seismic data volumes that otherwise would be overlooked. Not only does it provide the interpreter, the geologist and the reservoir engineer a valuable tool that significantly increases productivity and accuracy, but yields a better input for reservoir models and reduces risks associated with drilling locations.


Join the Conversation
Interested in starting, or contributing to a conversation about an article or issue of the RECORDER? Join our CSEG LinkedIn Group.
Share This Article