As I write this article, I am sitting on another airplane crossing the Atlantic, and I wonder why I promised Satinder that I would write an article about Time Lapse seismic monitoring for the RECORDER. On the other hand, it would have been very difficult to refuse since there are few other things that have affected my career (perhaps my life) over the past twenty years the way this subject has. In fact, the reason I am making this trip is to help another company get started on the interpretation of their first time lapse seismic dataset. Last month, when I made this same trip it was to teach another course on the same subject. I guess you get the idea. Since this subject is one of strong personal interest for me, I must caution you that I will take this opportunity to write a very subjective view of the history of the time lapse seismic monitoring technique and in the course of this, hopefully pass on some useful information.
My first exposure to Time Lapse seismic came in 1983 while I was working for GSI in Dallas. Arco had shot a small 3D survey and then re-shot the survey several months later and were very concerned that the event times on the two surveys did not precisely tie. I was called in because I was working in the R&D group and was supposed to know something about statics. At the time I wondered why anyone would care about 1 ms of static difference, until it was explained that they had gone to great expense to bury the geophones under a permanent gravel pad with the expectation that they would avoid exactly this sort of problem. Then I was really confused.
A little over a year later, while working back in Calgary, I was called into a meeting with Norm Pullin and Larry Matthews who were working for Amoco. They were planning a tiny and incredibly elaborate 3D seismic survey that would be repeated several times over the period of a few years (provided everything went as expected). Norm had come up with the idea for this project from a number of interesting sources. First, Amoco with their partners AOSTRA and PetroCanada, were planning a steam drive pilot in the tar sands near Gregoire Lake, just South of Fort McMurray. This pilot (Gregoire Lake In-situ Steam Pilot or GLISP) was adjacent to another Amoco lease where they had tried to produce the bitumen by injecting hydrocarbon solvent. The earlier pilot did not turn out well, as the injected solvent never turned up at any of the production or observation wells, although it was noticed later that they actually raised the surface elevation by a few centimeters! On the basis of this bad experience Norm thought there must be a role for seismic to locate where the injected steam might be headed.
Norm had heard something about the earlier Arco survey, and he knew that they were trying to monitor the progress of the fireflood production process. Norm and Larry were also aware of a controversial paper that Amos Nur of Stanford University had presented at a recent SPE meeting. Amos showed results that indicated that the seismic velocity through a tar saturated sand decreased dramatically as the sample was heated, and while many of the people in the audience argued passionately that this was only a laboratory artifact, Norm and Larry were convinced this could be the key to mapping the movement of the injected steam. However, they were also aware that the reservoir engineers had no exposure to seismic data and little confidence that it could possibly help. Norm knew they would only get one chance to make the project work.
Looking back over these past twenty years, it still amazes me how careful and thorough Norm and Larry were in the execution of that project. They insisted that this was simply a classical scientific experiment. Basically, they developed a hypothesis that the injected steam, and the resulting increasing temperature , would decrease the seismic velocity in the reservoir. If a seismic survey was recorded prior to steam injection, and another survey recorded afterwards, this difference in velocity should be detectable by timing changes on events below the heated zone as well as amplitude changes in the reservoir at the top and base of the steam chamber. Norm referred to it as a perfect seismic laboratory – what other chance would we get to record a survey, actually change the subsurface acoustic properties and then record another survey to see if we can observe the changes.
Having formed this hypothesis, they conducted a series of carefully controlled experiments to determine if the hypothesis was valid. First, they gathered core samples from one of the early wells and sent these core samples to Amos Nur for acoustic velocity measurements. The laboratory measurements confirmed that the acoustic velocity decreased significantly with temperature. Next, Larry Matthews modified the recorded sonic log to represent a range of thickness for a heated zone. Synthetic seismic traces were created for each of these scenarios and observations were made about the magnitude of the expected time delays and amplitude changes. Based on this initial success, they contracted a crew and recorded an exhaustive field test to determine if they could acquire data of sufficient quality and repeatability to observe the predicted differences. This is the point where I became more directly involved in the project, when with Norm’s encouragement; I took a job as GLISP project coordinator at Western Geophysical.
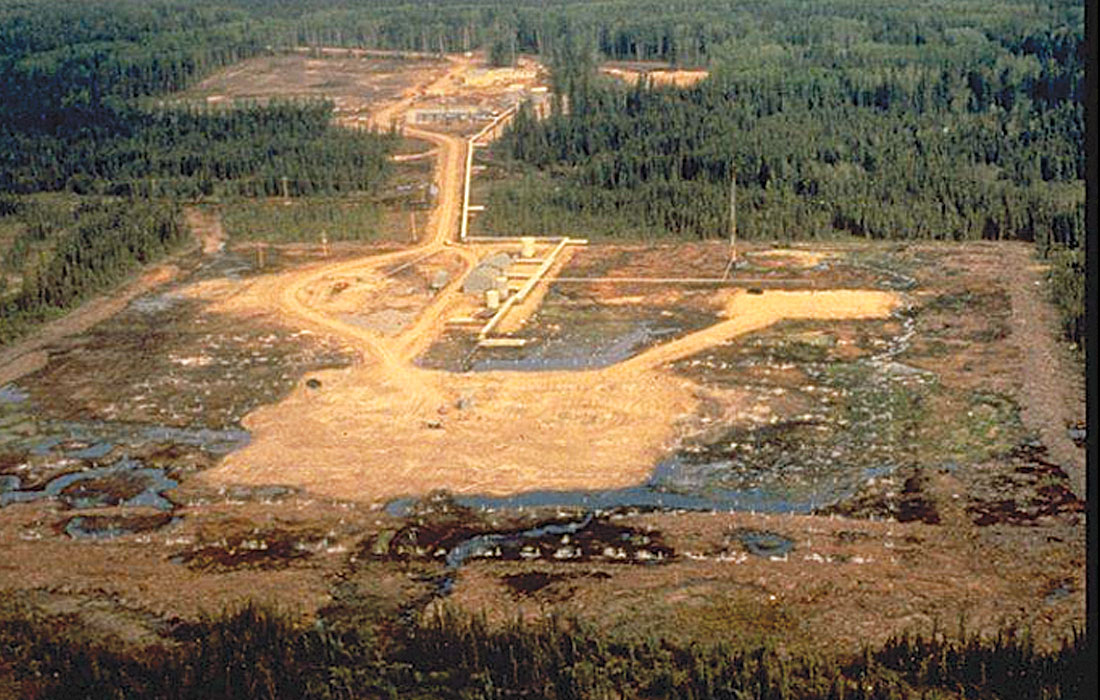
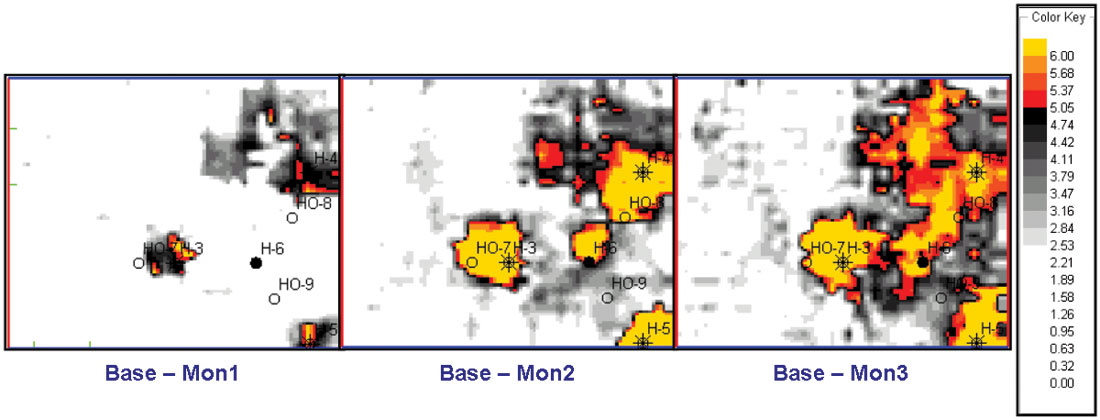
On the basis of the initial positive results, the 3D survey was finally recorded in April 1985(see Figure 1). The quality of the base survey data was exceptional, and it provided insight into some key features of the reservoir. Then we anxiously waited for the engineers to get the steam flood underway. When the first steam cycle was completed, we finally had the chance to record the first monitor survey and much to our relief, the time delays and amplitude changes predicted by the rock physics data and modeling clearly appeared in the seismic monitor. Two additional monitor surveys, recorded at key times in the production pilot, confirmed the seismic data could track the progress of the steam flood in the reservoir (see Figure 2).
I wish I could say it was all straight forward and easy, but unfortunately, there were several complications. While no one could dispute the seismic faithfully responded to changes in reservoir properties caused by steaming, the level of background repeatability (where no production occurred) was not as good as we had hoped. We had used a permanent array, highly repeatable explosive sources with cased shot-holes and consistent processing but seasonal variations in the near surface still caused a major difference in the final processed volumes. Even after many attempts, we were not able to successfully match the surveys without disturbing the production related signals. Further problems emerged where the sizes of the individual seismic anomalies were not consistent with the injected steam volumes at the corresponding wells and we did not have the rock physics knowledge required to explain these discrepancies. This did not help our credibility with the already skeptical reservoir engineers.
In the end, the GLISP project was a major technical success – the seismic monitoring technique clearly showed the progress of the steam flood in the reservoir. In spite of this, the engineers concluded that the data had no economic benefit to the overall project – that perceived failure of the business case haunts me to this day.
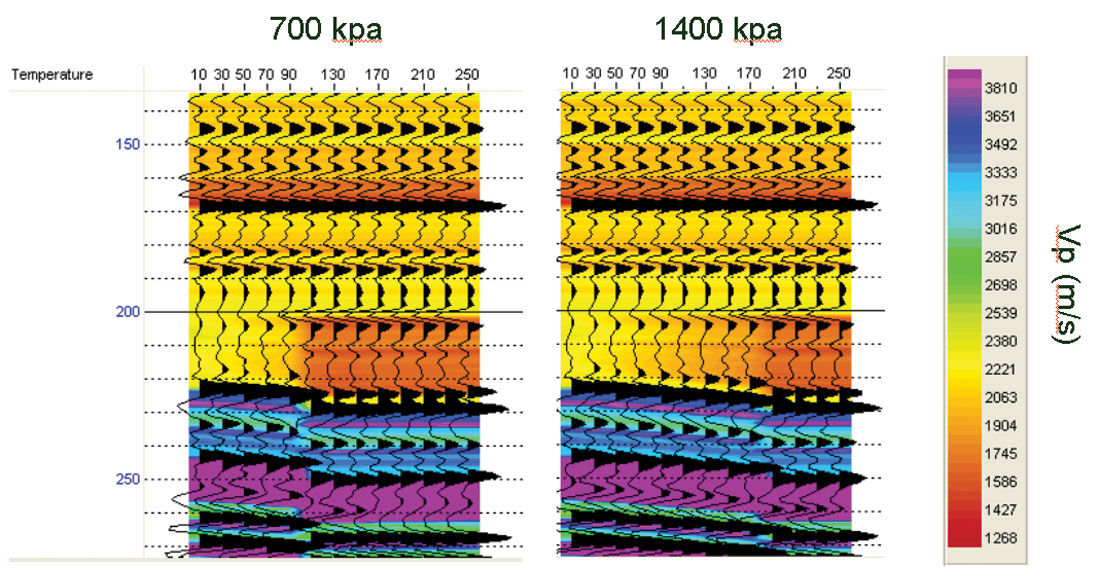
Progress in TimeLapse seismic development slowed through the late 80s and early 90s, at least partly due to a move away from the heavy oil business in Alberta (with the notable exception of Esso at Cold Lake where John Eastwood did some breakthrough work in quantifying the economic benefit of the technique.). Nonetheless, considerable advances in the technology were made during this time period. Much of this progress was due to the improved understanding of the changes in acoustic properties caused by production processes. Major contributions in this area were made by Mike Batzle and Zhijing Wang, thanks to their research on the acoustic properties of fluids. With this knowledge, the inconsistencies in the GLISP interpretation could finally be attributed to the complex interaction between pore pressure and fluid phase behaviour (see Figure 3). The insights gained in fluid properties and rock physics greatly helped in interpreting the observed time lapse responses and determining which types of production processes were suitable for monitoring.
Statoil and other companies working in the North Sea deserve a great deal of credit for moving the technology forward during the 90s. Much of this progress was due to the far-sighted regulatory environment of the Norwegian government which combined aggressive recovery goals for all of their fields with generous R&D tax credits and subsidies for implementing new technologies. The technical and economic success of TimeLapse seismic monitoring on these fields was widely demonstrated in a wide number of case history papers presented at EAGE over the past ten years. Almost universally, these papers have shown an excellent grasp of rock physics, time lapse seismic analysis and a detailed account of the economic benefits directly attributed to TimeLapse seismic monitoring. At least partly due to these efforts, the use of TimeLapse has become a widely accepted tool across much of the industry.
Over the past 20 years, I have had the opportunity to be involved in a wide range of projects where time lapse seismic has been used to monitor everything from water floods in sandstone reservoirs to CO2 floods in carbonates, yet I always come back to the basic fundamentals that Larry and Norm stressed with GLISP. Will the production process cause a significant change in the acoustic properties of the reservoir? Will these changes be visible on the seismic data? Can data be recorded over the field with the necessary level of quality and repeatability? If all of these conditions are met, the survey will be a technical success.
Two additional criteria are necessary for an economic success. First, can the observed seismic changes be successfully related to changes in reservoir saturation, pressure, temperature, etc? This is absolutely necessary for a quantitative interpretation but even a successful qualitative interpretation (which is often enough to make a big impact on recovery) can depend on this understanding. The second big factor is not really technical at all. It comes down to whether the engineers can/will be able to use the information to change the current production techniques in a way that will produce the available reserves in a more efficient and/or cost effective manner. The production improvements may come through improved placement of infill wells or changes to the injector/producer patterns. However, if the engineers don’t use the data to improve production over what they would have produced without the seismic, it is very difficult to claim an economic success.
In my opinion, in the last 5 years TimeLapse seismic monitoring has moved from the R&D phase to a proven tool. This increased confidence in the technology has come as a result of several key factors, including:
- Advances in the understanding of rock physics and fluid properties.
- Enhanced modeling that successfully predicts the seismic changes caused by production.
- Improvements in seismic processing and survey calibration for time lapse datasets
- Practical experiences gained and shared in a growing body of case history papers
- Closer working relationships between geophysicists, reservoir geologists and engineers
- Improved software that helps to integrate seismic analysis, rock physics, modeling and engineering data in a timely manner.
I feel very fortunate to have witnessed the development of this TimeLapse from a research idea to a mainstream technology. I also believe it is one of the most important technologies in our industry today. This is due to the unique potential that TimeLapse seismic data holds in monitoring the production process in the inter-well areas of the field. The insights gained from this monitoring technique can help to determine how the reservoir is compartmentalized and ultimately lead to higher recovery factors and better economics on existing fields. As new oil and gas fields are becoming increasingly difficult to find, the efficient exploitation of existing fields will play a very important role in satisfying the increasing demand for energy. I firmly believe that TimeLapse seismic data, combined with improved production monitoring, will become a standard tool for maximizing production on fields and production processes that are favourable for the technique.
Having just returned from my most recent visit to Europe, I might cite the experience of this past week to illustrate the c u r rent state of time lapse seismic technology. Although Amerada Hess in Denmark had no previous TimeLapse experience, their project on the South Arne Field is one of the best studies that I have ever seen. Initial feasibility planning considered not only whether the seismic data could detect the production- induced changes but also included a detailed economic plan showing the upcoming decisions that were required on the field combined with an analysis of how the time lapse seismic data might influence these decisions. Through this process, the engineers and geologists were already thinking about how they might use the monitoring data even before the first shot was recorded. Careful coordination with the acquisition and processing contractor enabled an extremely rapid turn-around of high quality datasets which were ready for analysis only six weeks after the survey commenced. Interpretation was also started on the base survey while the monitor survey was being acquired so everything was completely ready once the newly processed surveys arrived. Within two months of the survey start, results were shown to the development team and it is already safe to say that they will have a positive impact on the future development of the field. While the individuals involved with this project certainly deserve a great deal of credit, they have also demonstrated that TimeLapse seismic technology has come a very long way


Join the Conversation
Interested in starting, or contributing to a conversation about an article or issue of the RECORDER? Join our CSEG LinkedIn Group.
Share This Article